
 Yahoo Finance
 While shareholders of Beazley (LON:BEZ) are in the black over 3 years, those who bought a week ago aren't so fortunate
One simple way to benefit from the stock market is to buy an index fund. But if you buy good businesses at attractive prices, your portfolio returns could exceed the average market return. Just take a look at Beazley plc (LON:BEZ), which is up 88%, over three years, soundly beating the market return of 1.9% (not including dividends). On the other hand, the returns haven't been quite so good recently, with shareholders up just 9.4% , including dividends .
In light of the stock dropping 4.7% in the past week, we want to investigate the longer term story, and see if fundamentals have been the driver of the company's positive three-year return.
View our latest analysis for Beazley
While markets are a powerful pricing mechanism, share prices reflect investor sentiment, not just underlying business performance. By comparing earnings per share (EPS) and share price changes over time, we can get a feel for how investor attitudes to a company have morphed over time.
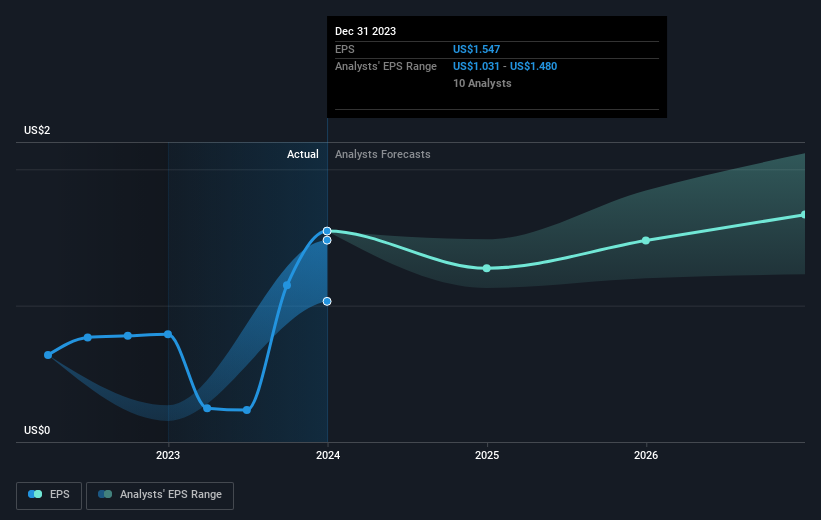
Beazley became profitable within the last three years. That would generally be considered a positive, so we'd expect the share price to be up.
You can see below how EPS has changed over time (discover the exact values by clicking on the image).
It is of course excellent to see how Beazley has grown profits over the years, but the future is more important for shareholders. You can see how its balance sheet has strengthened (or weakened) over time in this free interactive graphic.
What About Dividends?
It is important to consider the total shareholder return, as well as the share price return, for any given stock. The TSR is a return calculation that accounts for the value of cash dividends (assuming that any dividend received was reinvested) and the calculated value of any discounted capital raisings and spin-offs. So for companies that pay a generous dividend, the TSR is often a lot higher than the share price return. In the case of Beazley, it has a TSR of 102% for the last 3 years. That exceeds its share price return that we previously mentioned. The dividends paid by the company have thusly boosted the total shareholder return.
A Different Perspective
We're pleased to report that Beazley shareholders have received a total shareholder return of 9.4% over one year. That's including the dividend. That's better than the annualised return of 4% over half a decade, implying that the company is doing better recently. Given the share price momentum remains strong, it might be worth taking a closer look at the stock, lest you miss an opportunity. It's always interesting to track share price performance over the longer term. But to understand Beazley better, we need to consider many other factors. Even so, be aware that Beazley is showing 2 warning signs in our investment analysis , and 1 of those doesn't sit too well with us...
If you are like me, then you will not want to miss this free list of growing companies that insiders are buying.
Please note, the market returns quoted in this article reflect the market weighted average returns of stocks that currently trade on British exchanges.
Have feedback on this article? Concerned about the content? Get in touch with us directly. Alternatively, email editorial-team (at) simplywallst.com.
This article by Simply Wall St is general in nature. We provide commentary based on historical data and analyst forecasts only using an unbiased methodology and our articles are not intended to be financial advice. It does not constitute a recommendation to buy or sell any stock, and does not take account of your objectives, or your financial situation. We aim to bring you long-term focused analysis driven by fundamental data. Note that our analysis may not factor in the latest price-sensitive company announcements or qualitative material. Simply Wall St has no position in any stocks mentioned.
