
 Yahoo Finance
 Majestic Gold's (CVE:MJS) Returns Have Hit A Wall
Did you know there are some financial metrics that can provide clues of a potential multi-bagger? Amongst other things, we'll want to see two things; firstly, a growing return on capital employed (ROCE) and secondly, an expansion in the company's amount of capital employed. This shows us that it's a compounding machine, able to continually reinvest its earnings back into the business and generate higher returns. With that in mind, the ROCE of Majestic Gold (CVE:MJS) looks decent, right now, so lets see what the trend of returns can tell us.
Understanding Return On Capital Employed (ROCE)
If you haven't worked with ROCE before, it measures the 'return' (pre-tax profit) a company generates from capital employed in its business. Analysts use this formula to calculate it for Majestic Gold:
Return on Capital Employed = Earnings Before Interest and Tax (EBIT) ÷ (Total Assets - Current Liabilities)
0.12 = US$19m ÷ (US$187m - US$26m) (Based on the trailing twelve months to December 2023).
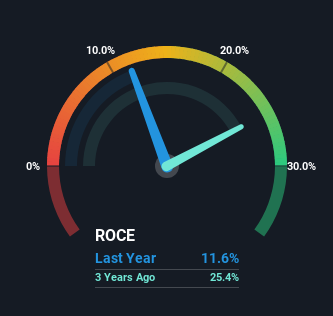
Therefore, Majestic Gold has an ROCE of 12%. In absolute terms, that's a satisfactory return, but compared to the Metals and Mining industry average of 1.7% it's much better.
See our latest analysis for Majestic Gold
While the past is not representative of the future, it can be helpful to know how a company has performed historically, which is why we have this chart above. If you want to delve into the historical earnings , check out these free graphs detailing revenue and cash flow performance of Majestic Gold.
So How Is Majestic Gold's ROCE Trending?
The trend of ROCE doesn't stand out much, but returns on a whole are decent. The company has employed 70% more capital in the last five years, and the returns on that capital have remained stable at 12%. 12% is a pretty standard return, and it provides some comfort knowing that Majestic Gold has consistently earned this amount. Stable returns in this ballpark can be unexciting, but if they can be maintained over the long run, they often provide nice rewards to shareholders.
What We Can Learn From Majestic Gold's ROCE
In the end, Majestic Gold has proven its ability to adequately reinvest capital at good rates of return. In light of this, the stock has only gained 17% over the last five years for shareholders who have owned the stock in this period. So because of the trends we're seeing, we'd recommend looking further into this stock to see if it has the makings of a multi-bagger.
Like most companies, Majestic Gold does come with some risks, and we've found 1 warning sign that you should be aware of.
While Majestic Gold may not currently earn the highest returns, we've compiled a list of companies that currently earn more than 25% return on equity. Check out this free list here.
Have feedback on this article? Concerned about the content? Get in touch with us directly. Alternatively, email editorial-team (at) simplywallst.com.
This article by Simply Wall St is general in nature. We provide commentary based on historical data and analyst forecasts only using an unbiased methodology and our articles are not intended to be financial advice. It does not constitute a recommendation to buy or sell any stock, and does not take account of your objectives, or your financial situation. We aim to bring you long-term focused analysis driven by fundamental data. Note that our analysis may not factor in the latest price-sensitive company announcements or qualitative material. Simply Wall St has no position in any stocks mentioned.
