
 Yahoo Finance
 Investors in U.S. Bancorp (NYSE:USB) have unfortunately lost 24% over the last three years
Many investors define successful investing as beating the market average over the long term. But the risk of stock picking is that you will likely buy under-performing companies. Unfortunately, that's been the case for longer term U.S. Bancorp (NYSE:USB) shareholders, since the share price is down 33% in the last three years, falling well short of the market return of around 15%. Unfortunately the share price momentum is still quite negative, with prices down 9.1% in thirty days. But this could be related to poor market conditions -- stocks are down 4.3% in the same time.
So let's have a look and see if the longer term performance of the company has been in line with the underlying business' progress.
View our latest analysis for U.S. Bancorp
To paraphrase Benjamin Graham: Over the short term the market is a voting machine, but over the long term it's a weighing machine. One way to examine how market sentiment has changed over time is to look at the interaction between a company's share price and its earnings per share (EPS).
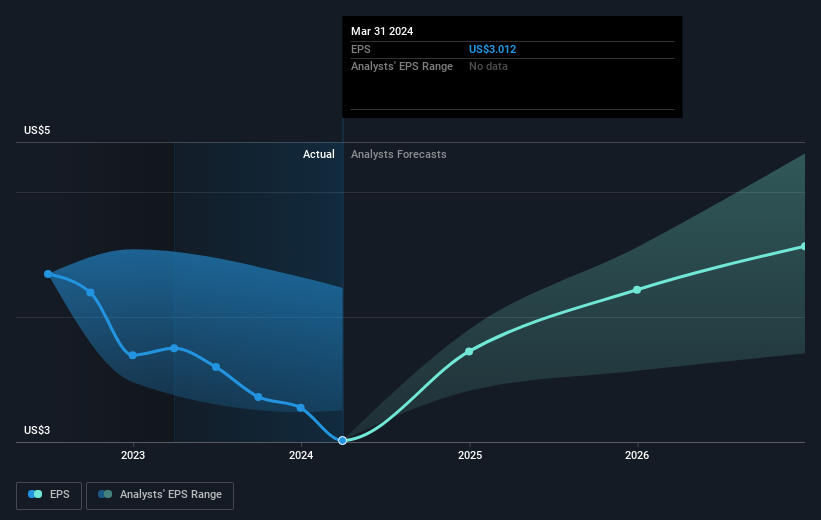
U.S. Bancorp saw its EPS decline at a compound rate of 7.6% per year, over the last three years. The share price decline of 12% is actually steeper than the EPS slippage. So it's likely that the EPS decline has disappointed the market, leaving investors hesitant to buy.
You can see how EPS has changed over time in the image below (click on the chart to see the exact values).
We consider it positive that insiders have made significant purchases in the last year. Having said that, most people consider earnings and revenue growth trends to be a more meaningful guide to the business. This free interactive report on U.S. Bancorp's earnings, revenue and cash flow is a great place to start, if you want to investigate the stock further.
What About Dividends?
As well as measuring the share price return, investors should also consider the total shareholder return (TSR). The TSR incorporates the value of any spin-offs or discounted capital raisings, along with any dividends, based on the assumption that the dividends are reinvested. Arguably, the TSR gives a more comprehensive picture of the return generated by a stock. We note that for U.S. Bancorp the TSR over the last 3 years was -24%, which is better than the share price return mentioned above. This is largely a result of its dividend payments!
A Different Perspective
We're pleased to report that U.S. Bancorp shareholders have received a total shareholder return of 40% over one year. And that does include the dividend. That certainly beats the loss of about 1.0% per year over the last half decade. This makes us a little wary, but the business might have turned around its fortunes. It is all well and good that insiders have been buying shares, but we suggest you check here to see what price insiders were buying at.
There are plenty of other companies that have insiders buying up shares. You probably do not want to miss this free list of growing companies that insiders are buying.
Please note, the market returns quoted in this article reflect the market weighted average returns of stocks that currently trade on American exchanges.
Have feedback on this article? Concerned about the content? Get in touch with us directly. Alternatively, email editorial-team (at) simplywallst.com.
This article by Simply Wall St is general in nature. We provide commentary based on historical data and analyst forecasts only using an unbiased methodology and our articles are not intended to be financial advice. It does not constitute a recommendation to buy or sell any stock, and does not take account of your objectives, or your financial situation. We aim to bring you long-term focused analysis driven by fundamental data. Note that our analysis may not factor in the latest price-sensitive company announcements or qualitative material. Simply Wall St has no position in any stocks mentioned.
