
 Yahoo Finance
 Emera Inc's Dividend Analysis
An In-Depth Look at Emera Inc's Upcoming Dividend and Its Sustainability
Emera Inc (EMRAF) recently announced a dividend of $0.72 per share, payable on 2024-05-15, with the ex-dividend date set for 2024-04-30. As investors look forward to this upcoming payment, the spotlight also shines on the company's dividend history, yield, and growth rates. Using the data from GuruFocus, let's look into Emera Inc's dividend performance and assess its sustainability.
What Does Emera Inc Do?
This Powerful Chart Made Peter Lynch 29% A Year For 13 Years
How to calculate the intrinsic value of a stock?
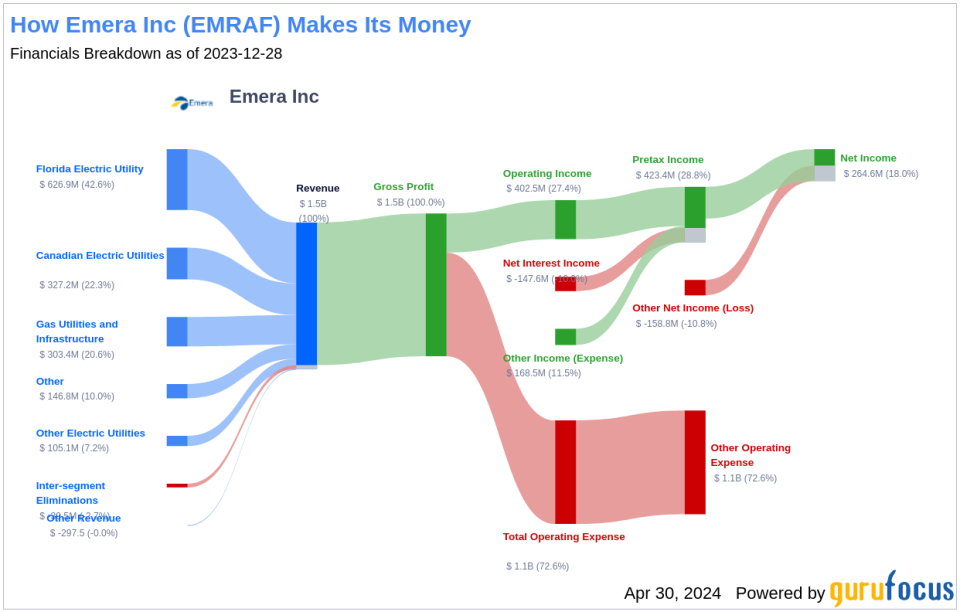
Emera is a geographically diverse energy and services company investing in electricity generation, transmission, and distribution as well as gas transmission and utility energy services. Emera has operations throughout North America and the Caribbean countries.
A Glimpse at Emera Inc's Dividend History
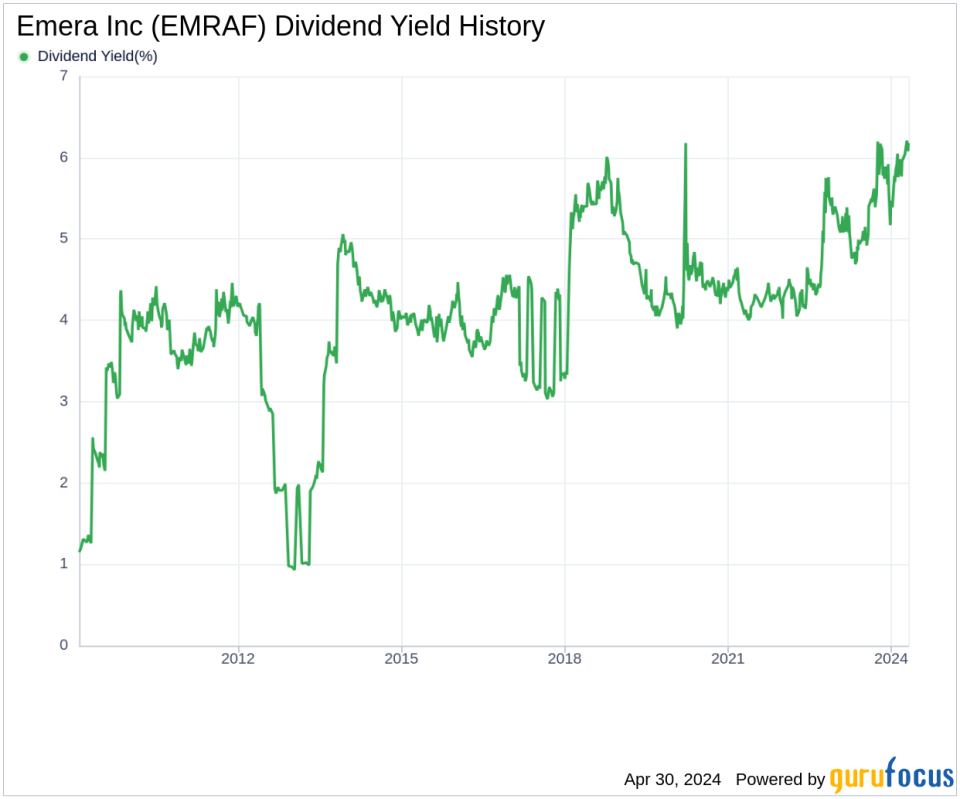
Emera Inc has maintained a consistent dividend payment record since 2009. Dividends are currently distributed on a quarterly basis. Below is a chart showing annual Dividends Per Share for tracking historical trends.
Breaking Down Emera Inc's Dividend Yield and Growth
As of today, Emera Inc currently has a 12-month trailing dividend yield of 6.05% and a 12-month forward dividend yield of 6.11%. This suggests an expectation of increased dividend payments over the next 12 months.
Over the past three years, Emera Inc's annual dividend growth rate was 4.00%. Extended to a five-year horizon, this rate increased to 4.10% per year. And over the past decade, Emera Inc's annual dividends per share growth rate stands at 7.20%.
Based on Emera Inc's dividend yield and five-year growth rate, the 5-year yield on cost of Emera Inc stock as of today is approximately 7.40%.
The Sustainability Question: Payout Ratio and Profitability
To assess the sustainability of the dividend, one needs to evaluate the company's payout ratio. The dividend payout ratio provides insights into the portion of earnings the company distributes as dividends. A lower ratio suggests that the company retains a significant part of its earnings, thereby ensuring the availability of funds for future growth and unexpected downturns. As of 2023-12-31, Emera Inc's dividend payout ratio is 0.78, and this may suggest that the company's dividend may not be sustainable.
Emera Inc's profitability rank, offers an understanding of the company's earnings prowess relative to its peers. GuruFocus ranks Emera Inc's profitability 7 out of 10 as of 2023-12-31, suggesting good profitability prospects. The company has reported positive net income for each of year over the past decade, further solidifying its high profitability.
Growth Metrics: The Future Outlook
To ensure the sustainability of dividends, a company must have robust growth metrics. Emera Inc's growth rank of 7 out of 10 suggests that the company's growth trajectory is good relative to its competitors.
Revenue is the lifeblood of any company, and Emera Inc's revenue per share, combined with the 3-year revenue growth rate, indicates a strong revenue model. Emera Inc's revenue has increased by approximately 7.60% per year on average, a rate that underperforms than approximately 55.47% of global competitors.
The company's 3-year EPS growth rate showcases its capability to grow its earnings, a critical component for sustaining dividends in the long run. During the past three years, Emera Inc's earnings increased by approximately 22.70% per year on average, a rate that underperforms than approximately 22.66% of global competitors.
Lastly, the company's 5-year EBITDA growth rate of 3.20%, which underperforms than approximately 57.91% of global competitors.
Next Steps
In conclusion, Emera Inc's robust dividend history and forward-looking yield projections make it an attractive option for income-focused investors. However, the sustainability of these dividends, as indicated by the payout ratio and profitability rank, may require careful consideration. Additionally, the company's growth metrics present a mixed picture, with strong revenue growth but some concerns about earnings and EBITDA growth relative to peers. Value investors should weigh these factors carefully when considering Emera Inc as a potential addition to their portfolios. GuruFocus Premium users can screen for high-dividend yield stocks using the High Dividend Yield Screener.
This article, generated by GuruFocus, is designed to provide general insights and is not tailored financial advice. Our commentary is rooted in historical data and analyst projections, utilizing an impartial methodology, and is not intended to serve as specific investment guidance. It does not formulate a recommendation to purchase or divest any stock and does not consider individual investment objectives or financial circumstances. Our objective is to deliver long-term, fundamental data-driven analysis. Be aware that our analysis might not incorporate the most recent, price-sensitive company announcements or qualitative information. GuruFocus holds no position in the stocks mentioned herein.
This article first appeared on GuruFocus.
