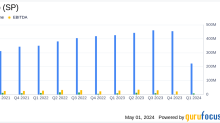
SP Plus Corporation (SP)
NasdaqGS - NasdaqGS Real Time Price. Currency in USD
Add to watchlist
At close: 04:00PM EDT
After hours:
| Previous Close | 51.50 |
| Open | 51.47 |
| Bid | 51.46 x 200 |
| Ask | 51.55 x 100 |
| Day's Range | 51.38 - 51.61 |
| 52 Week Range | 33.89 - 52.56 |
| Volume | |
| Avg. Volume | 198,108 |
| Market Cap | 1.02B |
| Beta (5Y Monthly) | 1.23 |
| PE Ratio (TTM) | 33.67 |
| EPS (TTM) | N/A |
| Earnings Date | N/A |
| Forward Dividend & Yield | N/A (N/A) |
| Ex-Dividend Date | N/A |
| 1y Target Est | N/A |
- GuruFocus.com
SP Plus Corp (SP) Announces First Quarter 2024 Earnings: A Detailed Review
Comparative Analysis of SP Plus Corp's Performance Against Analyst Estimates
- Zacks
SP Plus (SP) Lags Q4 Earnings and Revenue Estimates
SP Plus (SP) delivered earnings and revenue surprises of -29.41% and 7.75%, respectively, for the quarter ended December 2023. Do the numbers hold clues to what lies ahead for the stock?
- Insider Monkey
Bernzott Capital Advisors Exited SP Plus (SP) on Acquisition Announcement
Bernzott Capital Advisors, an investment management firm, published its “US Small Cap Value Fund” fourth-quarter 2023 investor letter, a copy of which can be downloaded here. In the fourth quarter, the portfolio gained +14.1% on a net basis, lagging behind R2000V’s advance of +15.2% and above R2500V’s rise of +13.7%. The largest contribution to the gains […]


© 2024 Yahoo. All rights reserved.