ExGen Resources Inc. (EXG.V)
| Previous Close | 0.0600 |
| Open | 0.0600 |
| Bid | 0.0500 x 0 |
| Ask | 0.0650 x 0 |
| Day's Range | 0.0500 - 0.0600 |
| 52 Week Range | 0.0500 - 0.1300 |
| Volume | |
| Avg. Volume | 3,114 |
| Market Cap | 3.195M |
| Beta (5Y Monthly) | 0.77 |
| PE Ratio (TTM) | N/A |
| EPS (TTM) | N/A |
| Earnings Date | N/A |
| Forward Dividend & Yield | N/A (N/A) |
| Ex-Dividend Date | N/A |
| 1y Target Est | N/A |
- GlobeNewswire
EXGEN: DOK Project Drill Results
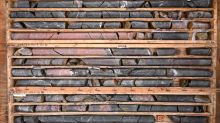
Figure 1 DK2023-03 from 229.1 to 237.7 meters yielding 8.6 meters of 0.57 Cu Eq (%). Figure 2 Plan view of chargeability merged from the 2014, 2022 and 2023 IP surveys. The merged data has not been leveled by a geophysicist and is for illustrative purposes only. Cross sections B-B’, and C-C’ in figures 3 and 4, respectively. Figure 3 Cartoon Cross Section through drill hole DK-2023-003 and chargeability. The merged data is from 3 programs, conducted in 2012, 2022 and October of 2023. It has not
- GlobeNewswire
ExGen: DOK Drilling Confirms Mineralization In Line With Golden Triangle Porphyry Copper-Gold Deposits
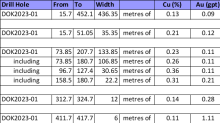
Table 1 Assay results for drill hole DOK2023-01 Figure 1 Cartoon Cross Section through drill holes DK-2023-001 (right) and DK-2014-001 (left) and chargeability. The merged data is from 3 programs, conducted in 2012, 2022 and October of 2023. It has not been leveled by a geophysicist and is for illustrative purposes only. Figure 2 Drill Hole Locations including 2014 and 2023 collars. Figure 3 DK-2023-001 strip log showing lithology, alteration, and assays. Figure 4 Plan view of chargeability merg
- GlobeNewswire
ExGen: DOK Project Progress
Figure 1: Dok ridge copper in soils with 2014 and 2023 drill hole collars. These data represent all the samples taken since the acquisition of the property in 2021. Figure 1: Dok ridge copper in soils with 2014 and 2023 drill hole collars. These data represent all the samples taken since the acquisition of the property in 2021. Figure 2: Dok ridge gold in soils with 2014 and 2023 drill hole collars. These data represent all the samples taken since the acquisition of the property in 2021. Figure