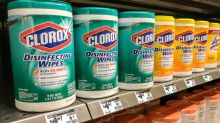
The Clorox Company (CLX)
NYSE - NYSE Delayed Price. Currency in USD
Add to watchlist
At close: 04:00PM EDT
After hours:
| Previous Close | 139.67 |
| Open | 139.50 |
| Bid | 136.90 x 900 |
| Ask | 143.05 x 800 |
| Day's Range | 138.19 - 139.98 |
| 52 Week Range | 114.69 - 170.44 |
| Volume | |
| Avg. Volume | 1,210,354 |
| Market Cap | 17.167B |
| Beta (5Y Monthly) | 0.42 |
| PE Ratio (TTM) | 71.25 |
| EPS (TTM) | 1.94 |
| Earnings Date | Jul 31, 2024 - Aug 05, 2024 |
| Forward Dividend & Yield | 4.80 (3.47%) |
| Ex-Dividend Date | Apr 23, 2024 |
| 1y Target Est | 150.29 |
 Zacks
ZacksWhy Clorox (CLX) is a Top Growth Stock for the Long-Term
Wondering how to pick strong, market-beating stocks for your investment portfolio? Look no further than the Zacks Style Scores.
 Simply Wall St.
Clorox Third Quarter 2024 Earnings: Misses Expectations
Clorox ( NYSE:CLX ) Third Quarter 2024 Results Key Financial Results Revenue: US$1.81b (down 5.3% from 3Q 2023). Net...
 Zacks
ZacksClorox (CLX) Q3 Earnings Beat Estimates, Revenues Down Y/Y
Clorox's (CLX) third-quarter fiscal 2024 bottom line benefits from pricing actions and cost-saving initiatives. The company also boasts a solid innovation pipeline.