
 Yahoo Finance
 Zuora, Inc.'s (NYSE:ZUO) Subdued P/S Might Signal An Opportunity
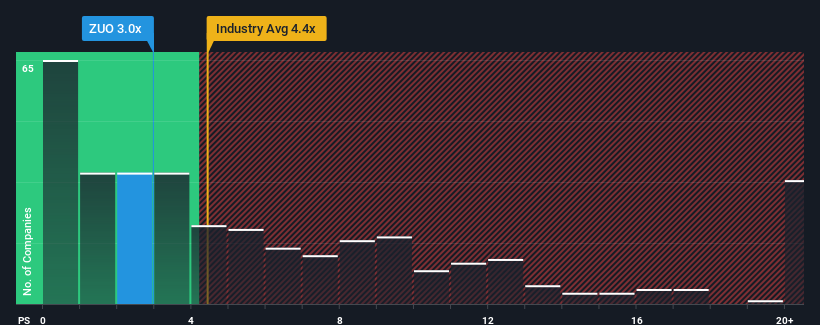
With a price-to-sales (or "P/S") ratio of 3x Zuora, Inc. (NYSE:ZUO) may be sending bullish signals at the moment, given that almost half of all the Software companies in the United States have P/S ratios greater than 4.4x and even P/S higher than 10x are not unusual. Although, it's not wise to just take the P/S at face value as there may be an explanation why it's limited.
Check out our latest analysis for Zuora
What Does Zuora's P/S Mean For Shareholders?
Zuora could be doing better as it's been growing revenue less than most other companies lately. Perhaps the market is expecting the current trend of poor revenue growth to continue, which has kept the P/S suppressed. If you still like the company, you'd be hoping revenue doesn't get any worse and that you could pick up some stock while it's out of favour.
Keen to find out how analysts think Zuora's future stacks up against the industry? In that case, our free report is a great place to start.
Do Revenue Forecasts Match The Low P/S Ratio?
There's an inherent assumption that a company should underperform the industry for P/S ratios like Zuora's to be considered reasonable.
Retrospectively, the last year delivered a decent 14% gain to the company's revenues. The latest three year period has also seen an excellent 43% overall rise in revenue, aided somewhat by its short-term performance. Therefore, it's fair to say the revenue growth recently has been superb for the company.
Looking ahead now, revenue is anticipated to climb by 14% per annum during the coming three years according to the seven analysts following the company. Meanwhile, the rest of the industry is forecast to expand by 13% per annum, which is not materially different.
With this information, we find it odd that Zuora is trading at a P/S lower than the industry. Apparently some shareholders are doubtful of the forecasts and have been accepting lower selling prices.
The Key Takeaway
Using the price-to-sales ratio alone to determine if you should sell your stock isn't sensible, however it can be a practical guide to the company's future prospects.
Our examination of Zuora's revealed that its P/S remains low despite analyst forecasts of revenue growth matching the wider industry. Despite average revenue growth estimates, there could be some unobserved threats keeping the P/S low. Perhaps investors are concerned that the company could underperform against the forecasts over the near term.
Plus, you should also learn about these 2 warning signs we've spotted with Zuora.
Of course, profitable companies with a history of great earnings growth are generally safer bets. So you may wish to see this free collection of other companies that have reasonable P/E ratios and have grown earnings strongly.
Have feedback on this article? Concerned about the content? Get in touch with us directly. Alternatively, email editorial-team (at) simplywallst.com.
This article by Simply Wall St is general in nature. We provide commentary based on historical data and analyst forecasts only using an unbiased methodology and our articles are not intended to be financial advice. It does not constitute a recommendation to buy or sell any stock, and does not take account of your objectives, or your financial situation. We aim to bring you long-term focused analysis driven by fundamental data. Note that our analysis may not factor in the latest price-sensitive company announcements or qualitative material. Simply Wall St has no position in any stocks mentioned.
Join A Paid User Research Session
You’ll receive a US$30 Amazon Gift card for 1 hour of your time while helping us build better investing tools for the individual investors like yourself. Sign up here
