
 Yahoo Finance
 New Zealand Oil & Gas (NZSE:NZO) Shareholders Will Want The ROCE Trajectory To Continue
Did you know there are some financial metrics that can provide clues of a potential multi-bagger? Firstly, we'll want to see a proven return on capital employed (ROCE) that is increasing, and secondly, an expanding base of capital employed. This shows us that it's a compounding machine, able to continually reinvest its earnings back into the business and generate higher returns. So when we looked at New Zealand Oil & Gas (NZSE:NZO) and its trend of ROCE, we really liked what we saw.
Understanding Return On Capital Employed (ROCE)
For those that aren't sure what ROCE is, it measures the amount of pre-tax profits a company can generate from the capital employed in its business. Analysts use this formula to calculate it for New Zealand Oil & Gas:
Return on Capital Employed = Earnings Before Interest and Tax (EBIT) ÷ (Total Assets - Current Liabilities)
0.11 = NZ$26m ÷ (NZ$282m - NZ$48m) (Based on the trailing twelve months to June 2022).
So, New Zealand Oil & Gas has an ROCE of 11%. In absolute terms, that's a pretty standard return but compared to the Oil and Gas industry average it falls behind.
View our latest analysis for New Zealand Oil & Gas
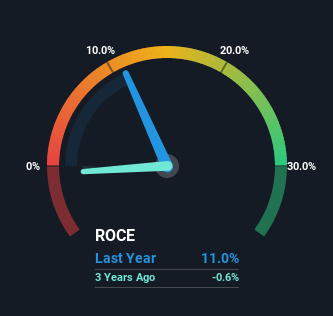
Historical performance is a great place to start when researching a stock so above you can see the gauge for New Zealand Oil & Gas' ROCE against it's prior returns. If you're interested in investigating New Zealand Oil & Gas' past further, check out this free graph of past earnings, revenue and cash flow.
What Does the ROCE Trend For New Zealand Oil & Gas Tell Us?
New Zealand Oil & Gas has recently broken into profitability so their prior investments seem to be paying off. About five years ago the company was generating losses but things have turned around because it's now earning 11% on its capital. In addition to that, New Zealand Oil & Gas is employing 44% more capital than previously which is expected of a company that's trying to break into profitability. This can indicate that there's plenty of opportunities to invest capital internally and at ever higher rates, both common traits of a multi-bagger.
For the record though, there was a noticeable increase in the company's current liabilities over the period, so we would attribute some of the ROCE growth to that. Essentially the business now has suppliers or short-term creditors funding about 17% of its operations, which isn't ideal. Keep an eye out for future increases because when the ratio of current liabilities to total assets gets particularly high, this can introduce some new risks for the business.
The Bottom Line
In summary, it's great to see that New Zealand Oil & Gas has managed to break into profitability and is continuing to reinvest in its business. Given the stock has declined 30% in the last five years, this could be a good investment if the valuation and other metrics are also appealing. So researching this company further and determining whether or not these trends will continue seems justified.
New Zealand Oil & Gas does come with some risks though, we found 4 warning signs in our investment analysis, and 1 of those doesn't sit too well with us...
While New Zealand Oil & Gas may not currently earn the highest returns, we've compiled a list of companies that currently earn more than 25% return on equity. Check out this free list here.
Have feedback on this article? Concerned about the content? Get in touch with us directly. Alternatively, email editorial-team (at) simplywallst.com.
This article by Simply Wall St is general in nature. We provide commentary based on historical data and analyst forecasts only using an unbiased methodology and our articles are not intended to be financial advice. It does not constitute a recommendation to buy or sell any stock, and does not take account of your objectives, or your financial situation. We aim to bring you long-term focused analysis driven by fundamental data. Note that our analysis may not factor in the latest price-sensitive company announcements or qualitative material. Simply Wall St has no position in any stocks mentioned.
Join A Paid User Research Session
You’ll receive a US$30 Amazon Gift card for 1 hour of your time while helping us build better investing tools for the individual investors like yourself. Sign up here
