
 Yahoo Finance
 Yunji (NASDAQ:YJ) shareholders are up 12% this past week, but still in the red over the last three years
While not a mind-blowing move, it is good to see that the Yunji Inc. (NASDAQ:YJ) share price has gained 17% in the last three months. But that doesn't change the fact that the returns over the last three years have been stomach churning. In that time the share price has melted like a snowball in the desert, down 89%. Arguably, the recent bounce is to be expected after such a bad drop. Only time will tell if the company can sustain the turnaround. While a drop like that is definitely a body blow, money isn't as important as health and happiness.
Although the past week has been more reassuring for shareholders, they're still in the red over the last three years, so let's see if the underlying business has been responsible for the decline.
View our latest analysis for Yunji
In his essay The Superinvestors of Graham-and-Doddsville Warren Buffett described how share prices do not always rationally reflect the value of a business. One way to examine how market sentiment has changed over time is to look at the interaction between a company's share price and its earnings per share (EPS).
Yunji became profitable within the last five years. That would generally be considered a positive, so we are surprised to see the share price is down. So given the share price is down it's worth checking some other metrics too.
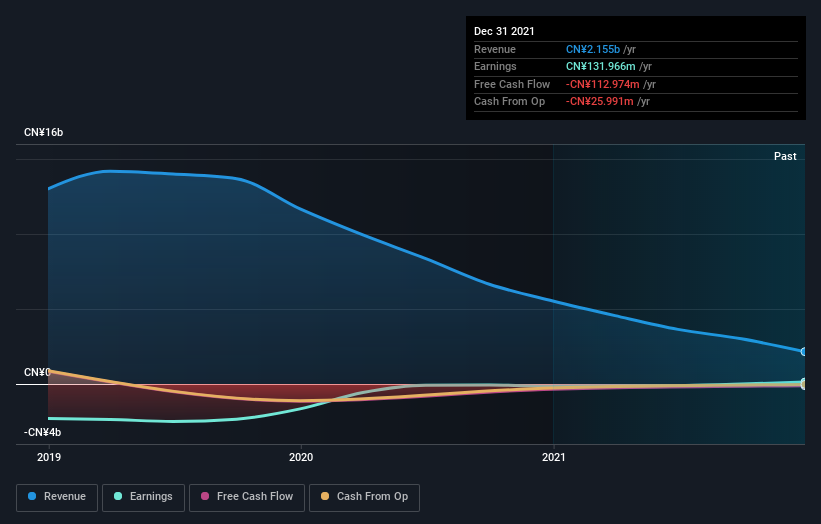
We think that the revenue decline over three years, at a rate of 53% per year, probably had some shareholders looking to sell. And that's not surprising, since it seems unlikely that EPS growth can continue for long in the absence of revenue growth.
The graphic below depicts how earnings and revenue have changed over time (unveil the exact values by clicking on the image).
You can see how its balance sheet has strengthened (or weakened) over time in this free interactive graphic.
A Different Perspective
Yunji shareholders are down 36% for the year, falling short of the market return. Meanwhile, the broader market slid about 10%, likely weighing on the stock. Unfortunately, the longer term story isn't pretty, with investment losses running at 24% per year over three years. We'd need clear signs of growth in the underlying business before we could muster much enthusiasm for this one. It's always interesting to track share price performance over the longer term. But to understand Yunji better, we need to consider many other factors. Case in point: We've spotted 2 warning signs for Yunji you should be aware of, and 1 of them shouldn't be ignored.
If you would prefer to check out another company -- one with potentially superior financials -- then do not miss this free list of companies that have proven they can grow earnings.
Please note, the market returns quoted in this article reflect the market weighted average returns of stocks that currently trade on US exchanges.
Have feedback on this article? Concerned about the content? Get in touch with us directly. Alternatively, email editorial-team (at) simplywallst.com.
This article by Simply Wall St is general in nature. We provide commentary based on historical data and analyst forecasts only using an unbiased methodology and our articles are not intended to be financial advice. It does not constitute a recommendation to buy or sell any stock, and does not take account of your objectives, or your financial situation. We aim to bring you long-term focused analysis driven by fundamental data. Note that our analysis may not factor in the latest price-sensitive company announcements or qualitative material. Simply Wall St has no position in any stocks mentioned.
