
 Yahoo Finance
 Yunji (NASDAQ:YJ) Might Have The Makings Of A Multi-Bagger
If we want to find a stock that could multiply over the long term, what are the underlying trends we should look for? Ideally, a business will show two trends; firstly a growing return on capital employed (ROCE) and secondly, an increasing amount of capital employed. If you see this, it typically means it's a company with a great business model and plenty of profitable reinvestment opportunities. Speaking of which, we noticed some great changes in Yunji's (NASDAQ:YJ) returns on capital, so let's have a look.
Return On Capital Employed (ROCE): What is it?
For those who don't know, ROCE is a measure of a company's yearly pre-tax profit (its return), relative to the capital employed in the business. To calculate this metric for Yunji, this is the formula:
Return on Capital Employed = Earnings Before Interest and Tax (EBIT) ÷ (Total Assets - Current Liabilities)
0.012 = CN¥17m ÷ (CN¥2.3b - CN¥866m) (Based on the trailing twelve months to December 2021).
So, Yunji has an ROCE of 1.2%. Ultimately, that's a low return and it under-performs the Online Retail industry average of 11%.
See our latest analysis for Yunji
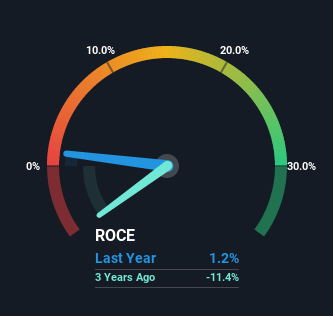
Historical performance is a great place to start when researching a stock so above you can see the gauge for Yunji's ROCE against it's prior returns. If you're interested in investigating Yunji's past further, check out this free graph of past earnings, revenue and cash flow.
How Are Returns Trending?
We're delighted to see that Yunji is reaping rewards from its investments and is now generating some pre-tax profits. Shareholders would no doubt be pleased with this because the business was loss-making five years ago but is is now generating 1.2% on its capital. Not only that, but the company is utilizing 2,034% more capital than before, but that's to be expected from a company trying to break into profitability. This can tell us that the company has plenty of reinvestment opportunities that are able to generate higher returns.
On a related note, the company's ratio of current liabilities to total assets has decreased to 37%, which basically reduces it's funding from the likes of short-term creditors or suppliers. Therefore we can rest assured that the growth in ROCE is a result of the business' fundamental improvements, rather than a cooking class featuring this company's books.
In Conclusion...
In summary, it's great to see that Yunji has managed to break into profitability and is continuing to reinvest in its business. And since the stock has dived 92% over the last three years, there may be other factors affecting the company's prospects. In any case, we believe the economic trends of this company are positive and looking into the stock further could prove rewarding.
Yunji does come with some risks though, we found 2 warning signs in our investment analysis, and 1 of those shouldn't be ignored...
While Yunji isn't earning the highest return, check out this free list of companies that are earning high returns on equity with solid balance sheets.
Have feedback on this article? Concerned about the content? Get in touch with us directly. Alternatively, email editorial-team (at) simplywallst.com.
This article by Simply Wall St is general in nature. We provide commentary based on historical data and analyst forecasts only using an unbiased methodology and our articles are not intended to be financial advice. It does not constitute a recommendation to buy or sell any stock, and does not take account of your objectives, or your financial situation. We aim to bring you long-term focused analysis driven by fundamental data. Note that our analysis may not factor in the latest price-sensitive company announcements or qualitative material. Simply Wall St has no position in any stocks mentioned.
