
 Yahoo Finance
 Is Yangaroo Inc. (CVE:YOO) Overpaying Its CEO?

Want to participate in a short research study? Help shape the future of investing tools and you could win a $250 gift card!
Gary Moss has been the CEO of Yangaroo Inc. (CVE:YOO) since 2012. First, this article will compare CEO compensation with compensation at similar sized companies. Then we'll look at a snap shot of the business growth. And finally we will reflect on how common stockholders have fared in the last few years, as a secondary measure of performance. The aim of all this is to consider the appropriateness of CEO pay levels.
See our latest analysis for Yangaroo
How Does Gary Moss's Compensation Compare With Similar Sized Companies?
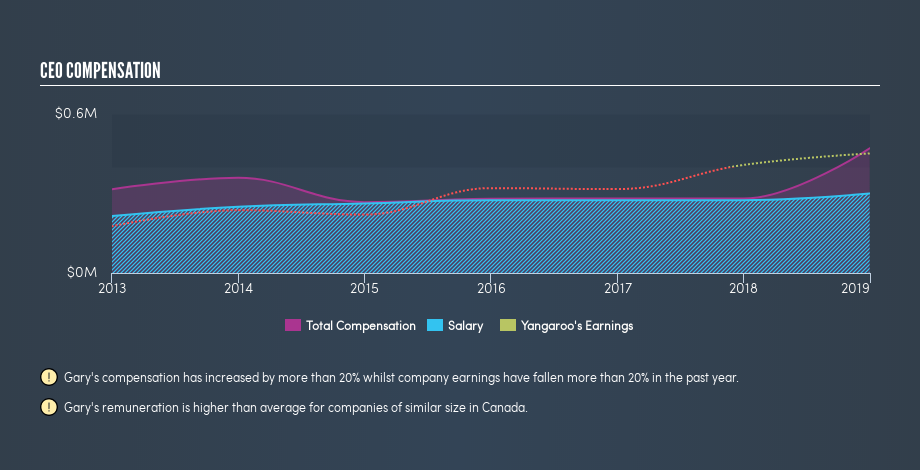
At the time of writing our data says that Yangaroo Inc. has a market cap of CA$8.3m, and is paying total annual CEO compensation of CA$471k. (This is based on the year to December 2018). While this analysis focuses on total compensation, it's worth noting the salary is lower, valued at CA$300k. We took a group of companies with market capitalizations below CA$262m, and calculated the median CEO total compensation to be CA$120k.
Thus we can conclude that Gary Moss receives more in total compensation than the median of a group of companies in the same market, and of similar size to Yangaroo Inc.. However, this doesn't necessarily mean the pay is too high. A closer look at the performance of the underlying business will give us a better idea about whether the pay is particularly generous.
You can see, below, how CEO compensation at Yangaroo has changed over time.
Is Yangaroo Inc. Growing?
Yangaroo Inc. has increased its earnings per share (EPS) by an average of 109% a year, over the last three years (using a line of best fit). It saw its revenue drop -8.8% over the last year.
This shows that the company has improved itself over the last few years. Good news for shareholders. Revenue growth is a real positive for growth, but ultimately profits are more important. Although we don't have analyst forecasts, you might want to assess this data-rich visualization of earnings, revenue and cash flow.
Has Yangaroo Inc. Been A Good Investment?
With a total shareholder return of 3.8% over three years, Yangaroo Inc. has done okay by shareholders. But they probably wouldn't be so happy as to think the CEO should be paid more than is normal, for companies around this size.
In Summary...
We compared total CEO remuneration at Yangaroo Inc. with the amount paid at companies with a similar market capitalization. As discussed above, we discovered that the company pays more than the median of that group.
Importantly, though, the company has impressed with its earnings per share growth, over three years. We also note that, over the same time frame, shareholder returns haven't been bad. You might wish to research management further, but on this analysis, considering the EPS growth, we wouldn't call the CEO pay problematic. Shareholders may want to check for free if Yangaroo insiders are buying or selling shares.
Important note: Yangaroo may not be the best stock to buy. You might find something better in this list of interesting companies with high ROE and low debt.
We aim to bring you long-term focused research analysis driven by fundamental data. Note that our analysis may not factor in the latest price-sensitive company announcements or qualitative material.
If you spot an error that warrants correction, please contact the editor at editorial-team@simplywallst.com. This article by Simply Wall St is general in nature. It does not constitute a recommendation to buy or sell any stock, and does not take account of your objectives, or your financial situation. Simply Wall St has no position in the stocks mentioned. Thank you for reading.
