
 Yahoo Finance
 Yamana Gold Reports Updated Mineral Reserves and Mineral Resources Highlighting the Sustainability of Its Production Platform

Figure 1

Figure 2
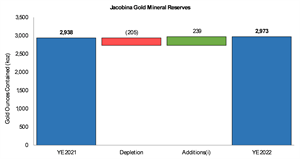
Figure 3
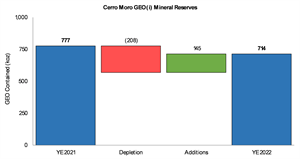
Figure 4

Figure 5

Figure 6

TORONTO, March 29, 2023 (GLOBE NEWSWIRE) -- Yamana Gold Inc. (TSX:YRI; NYSE:AUY; LSE:AUY) (“Yamana” or the “Company”) herein provides its updated mineral reserve and mineral resource estimates as at December 31, 2022 highlighting the ongoing sustainability of the Company's production platform. The Company’s continued success in replacing mineral reserves is further underscored by its strong 2022 operating results which, as previously reported, exceeded annual guidance with full year production of 1,005,770 gold equivalent ounces (“GEO”)(1) at an all-in sustaining cost (“AISC”)(2) below $1,125 per GEO(1).
Following the overwhelming support of the respective special resolutions of the shareholders of each of Yamana and Pan American Silver Corp. (“Pan American”) on January 31, 2023, in connection with approving the acquisition by Pan American of all of the issued and outstanding common shares of the Company following the sale by Yamana of its Canadian assets, including certain subsidiaries and partnerships which hold Yamana’s interests in the Canadian Malartic mine, to Agnico Eagle Mines Limited, all by way of a plan of arrangement under the Canada Business Corporations Act (the “Proposed Transaction”), this news release is anticipated to be Yamana’s final announcement covering mineral reserve and mineral resource update matters. Further details including tonnes, grade and assumptions are presented in the full Mineral Reserves and Mineral Resources table below while all Mineral Resources reported herein are exclusive of Mineral Reserves. The Proposed Transaction is expected to close by the end of the month.
Yamana also announces that it has filed its consolidated fourth quarter and year-end 2022 financial results, which are available under the Company’s profile on SEDAR at www.sedar.com and on the Company’s website.
HIGHLIGHTS
Track Record of Mineral Reserves Replacement: On an aggregate basis across its wholly-owned operations, the Company replaced gold mineral reserves by 104% of depletion highlighting the sustainability and longevity of its production platform.
Continued Success of Mineral Reserve Growth at Jacobina: Jacobina had another year of mineral reserve and mineral resource growth, adding approximately 35,000 ounces of gold mineral reserves, or 117% of depletion. Gold mineral reserves have grown by 57% or more than 1 million ounces net of depletion over the past five years to 2.97 million ounces and mineral resources have increased by 80% over the same period, as detailed below. The track record of growth in mineral reserves and mineral resources at Jacobina underpins its significant prospectivity and geological upside.
Conversion of Inferred Mineral Resources at Odyssey: At Odyssey, the ongoing infill drilling program continues to increase the inventory of indicated mineral resources to support the potential conversion of mineral resources to mineral reserves. Indicated gold mineral resources increased by over 3.81 million ounces to 6.17 million ounces with total inferred resources at year end of 9.23 million ounces (100% basis). Exploration drilling at the East Gouldie zone of the Odyssey mine also continues to grow the mineralized footprint with new intercepts to the west of the known mineral resource envelope highlighting the generational nature of the deposit.
Fifth Consecutive Year of Increasing Mineral Reserves at El Peñón: El Peñón achieved a fifth consecutive year of adding mineral reserves in excess of depletion, with mineral reserves growing 4% to 1.37 million GEO(1), or by 123% of depletion, over the last year.
Company-wide Mineral Reserves and Mineral Resources Show Significant Scale: As at December 31, 2022, the Company reports 13.8 million ounces of gold mineral reserves and 112 million ounces of silver mineral reserves, relatively unchanged from the prior year. Further, the Company reports measured and indicated mineral resources of 17.1 million ounces of gold, 52 million ounces of silver, and 1.4 billion pounds of copper exclusive of mineral reserves, with measured and indicated gold mineral resources up 18% from the prior year. Inferred mineral resources contain 13.3 million ounces of gold, 60 million ounces of silver, and 2.13 billion pounds of copper. At the Company’s development projects, mineral reserves of 7.4 million ounces of gold, 57 million ounces of silver, and 6.7 billion pounds of copper represent significant upside potential within the existing portfolio.
YEAR END MINERAL RESERVES AND MINERAL RESOURCES SUMMARY
Canadian Malartic including Odyssey, Canada (50%)
The Canadian Malartic & Barnat Open Pit saw a decrease of approximately 263,000 ounces of gold in proven and probable mineral reserves (reflecting the Company’s 50% interest) driven primarily by depletion of 360,000 ounces of gold (50% interest) as the Canadian Malartic pit enters into its final years of operation and open pit mining transitions to the Barnat pit. With initial production from the underground Odyssey mine at Canadian Malartic having commenced earlier this month, an initial small portion of the indicated mineral resources at the Odyssey South deposit was converted to probable mineral reserves as at December 31, 2022, adding 98,000 ounces of gold in mineral reserves (50% interest). A substantial addition of mineral reserves is expected at the Odyssey project at year-end 2023 with the conversion of indicated mineral resources at the East Gouldie deposit where continued conversion drilling success resulted in the addition of 1.9 million ounces of gold in indicated mineral resources (50% interest) during the year.
Figure 1: Change in Proven and Probable Mineral Reserves at Canadian Malartic
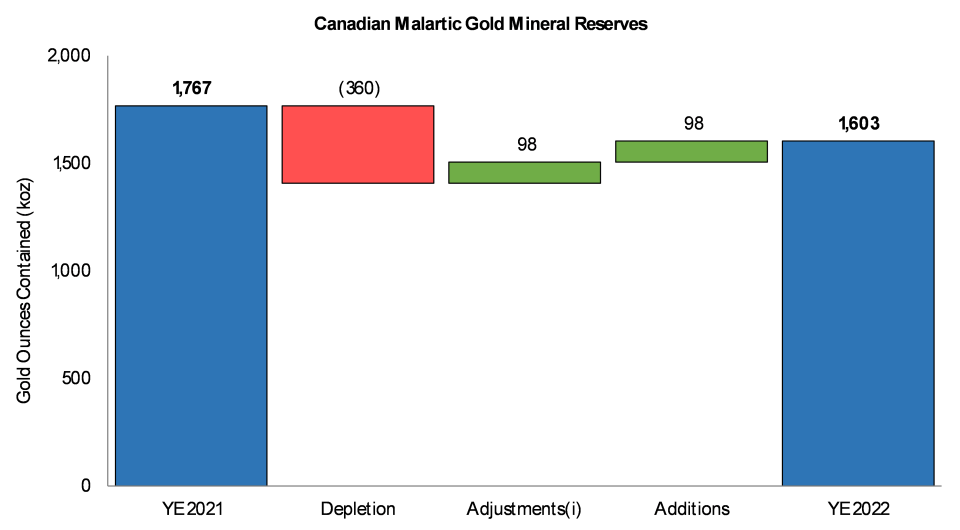
(i) Adjustments for stockpile inventory variation and optimizations
At the Odyssey project, underground development remains on schedule with initial production and start of shaft sinking expected in March 2023. With only 0.4 million ounces of gold in indicated mineral resources and 6.9 million ounces of gold in inferred mineral resources, or approximately 47% of the Odyssey mineral resources included in the mine plan outlined in the March 2021 technical study on a 100% basis, there is significant upside potential to a mine life already expected to last until at least 2039. Additionally, drilling continues to delineate the Odyssey internal zones, which were not previously considered in the 2021 preliminary economic assessment mine plan. The Odyssey team is in the process of optimizing the mine plan with these drilling results, which is expected to result in higher gold production during the construction period, further offsetting the initial capital cost and optimizing the cash flow profile starting in 2023.
As previously reported, exploration drilling of the East Gouldie Extension and parallel Titan zone indicate that a corridor of mineralization extends at least 1.3 kilometres to the east of East Gouldie and over an approximate 2,000 metre vertical extent. The Company believes that the underground development will support a significantly higher level of production than assumed in the current mine plan with more production that could come from further ramp development and from a possible second shaft at depth where mineralization remains open in all directions.
Drilling demonstrates that the East Gouldie deposit also extends significantly to the west of the mineral resource envelope at significant grades and widths. Overall, drilling indicates that the East Gouldie deposit extends more than 4 kilometres along strike, of which only approximately 1.5 kilometres is currently reported as mineral resources. Thirteen drill rigs are currently active on the property, with five underground drills in the Odyssey South and Internal zones and eight surface drills focused on infilling and expanding the East Gouldie mineralization.
Jacobina, Brazil
Jacobina had another successful year of exploration, adding approximately 35,000 ounces of gold mineral reserves net of depletion, with additions of 239,000 gold ounces amounting to 117% of depletion. Gold mineral reserves have grown by 57% or more than 1 million ounces over the past five years to 2.97 million ounces. Mineral resources have increased by 80% over the same period, with mineral resources, exclusive of mineral reserves, increasing by 328,000 ounces of gold in measured and indicated mineral resources and 30,000 ounces of gold in inferred mineral resources versus the prior year. Mineral reserves average gold grade is unchanged from the previous year at 2.18 g/t. Highlights from 2022 include ongoing infill drilling success at João Belo Sul and Morro do Vento and successful exploration drilling at the new Morro do Vento Leste zone.
Figure 2: Change in Proven and Probable Mineral Reserves at Jacobina
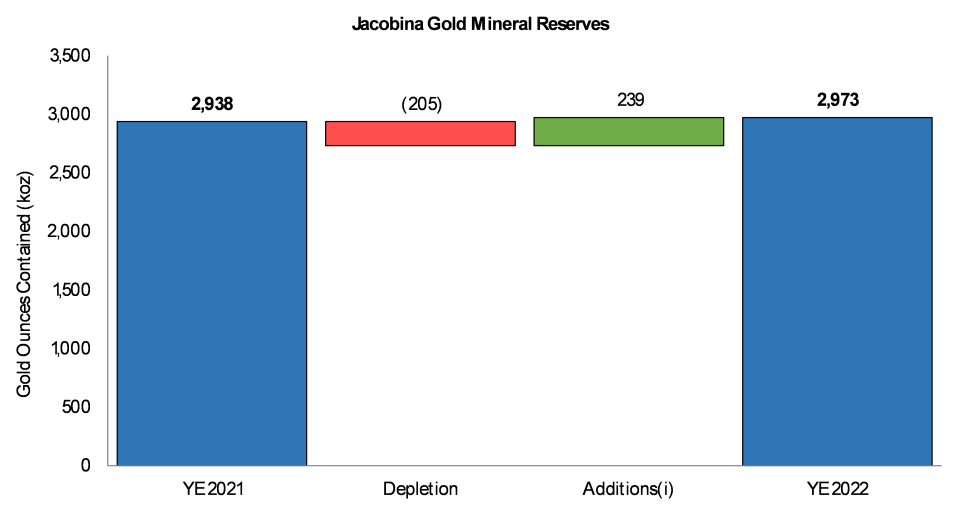
(i) Additions from infill drilling and new mine
Cerro Moro, Argentina
At Cerro Moro, mineral reserves changed due to 2022 depletion and adjustments to the geological models, partly offset by additions to the mineral reserves inventory from successful infill and delineation drilling. While gold ounces added by drilling covered annual depletion, an updated block model at Verónica caused an overall decrease of approximately 11,000 gold ounces. Depletion during 2022 was primarily from Zoe, a higher grade silver deposit, resulting in an overall decline of approximately 3.6 million silver ounces contained in mineral reserves.
Figure 3: Change in Proven and Probable Mineral Reserves at Cerro Moro
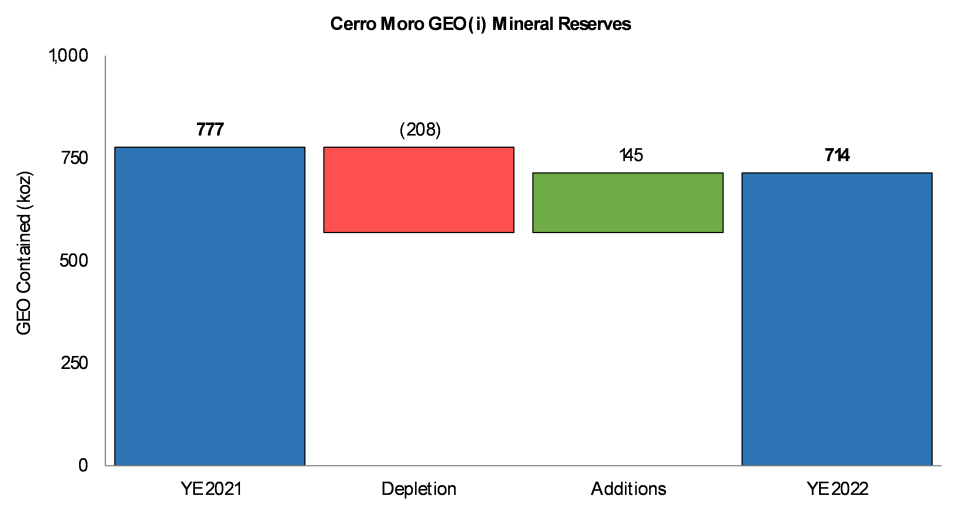
(i) Gold Equivalent Ounces (GEO) calculated using mineral reserves metal price assumptions of $1,250 per ounce of gold and $18 per ounce of silver, and metallurgical recoveries of 94% for gold and 95% for silver.
El Peñón, Chile
Successful drilling at El Peñón resulted in the operation achieving a fifth consecutive year of adding new mineral reserves in excess of mining depletion, with mineral reserves growing 28% to 1.37 million GEO(1) over that period. The replacement of depletion maintains the El Peñón mine life at five to six years. Infill drilling, mainly at the Pampa Campamento and Martillo Flat veins, together with the conversion of underground mineral resources to mineral reserves at Chiquilla Chica, which is being reported for the first time, account for the replacement of gold ounce depletion and the increase of silver ounces contained in mineral reserves.
Figure 4: Change in Proven and Probable Mineral Reserves at El Peñón
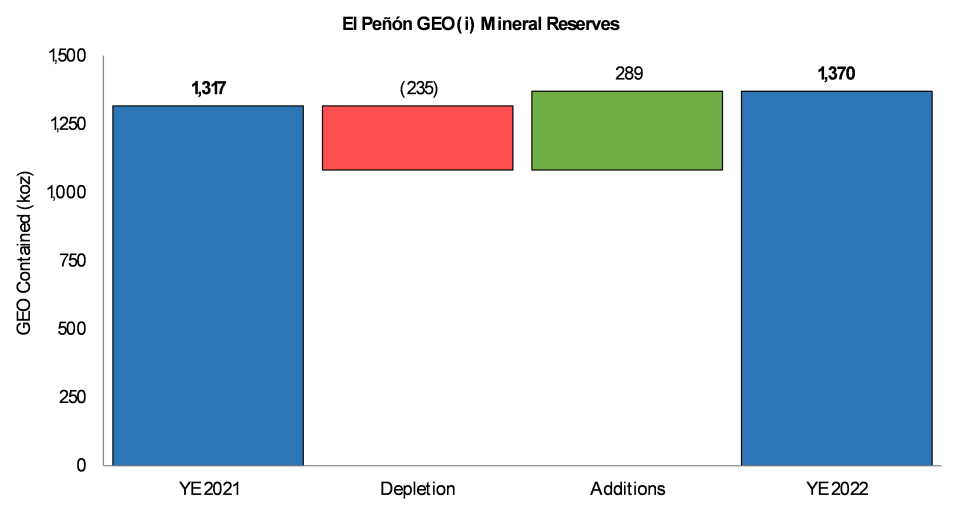
(i) Gold Equivalent Ounces (GEO) calculated using mineral reserves metal price assumptions of $1,250 per ounce of gold and $18 per ounce of silver, and metallurgical recoveries of 95% for gold and 86% for silver.
Minera Florida, Chile
At Minera Florida, new mineral reserves replaced mining depletion, extending the mine life. Gold ounces contained in mineral resources and mineral reserves have increased across most main zones with significant success at Maqui due to infill drilling and inaugural mineral reserves added at the Cucaracha zone.
Figure 5: Change in Proven and Probable Mineral Reserves at Minera Florida
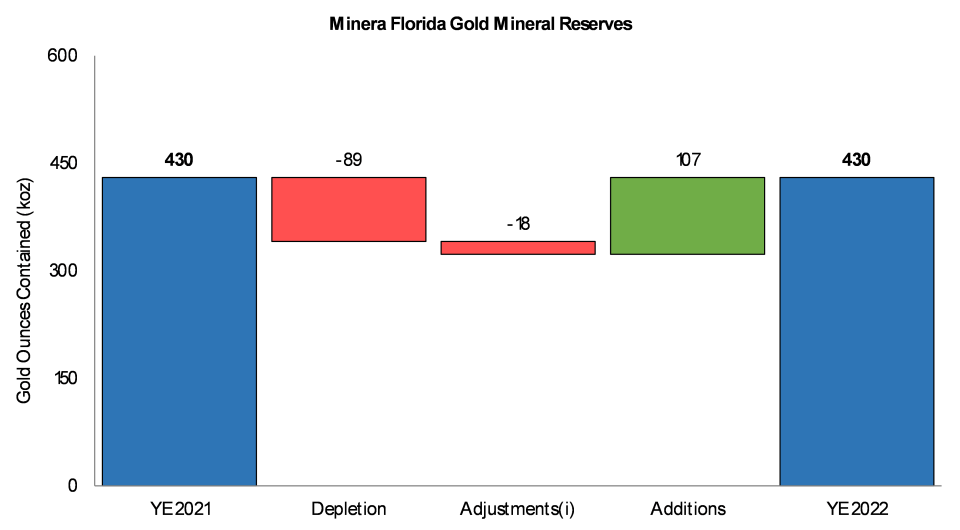
(i) Adjustments for geomechanical study at the Alhue Core zone which will be considered for future reserve estimates
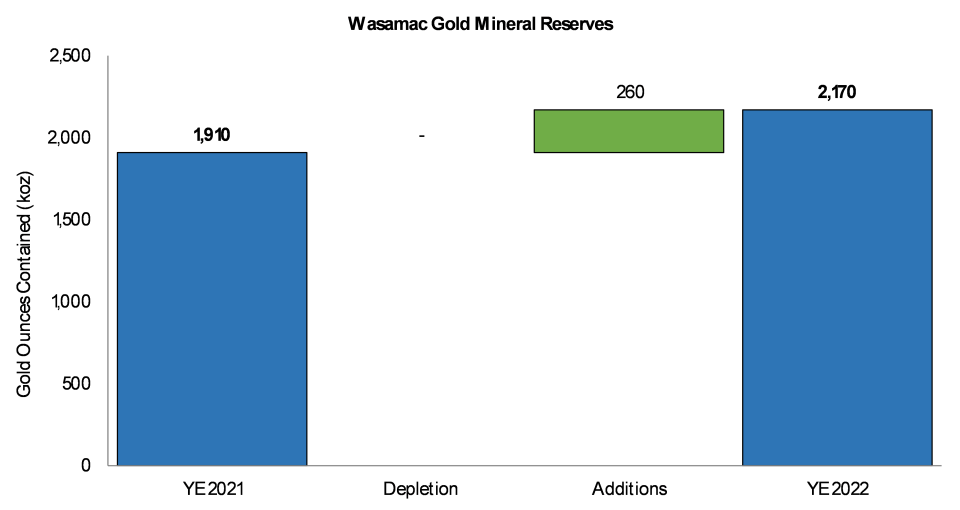
Wasamac, Canada
Wasamac mineral reserves and mineral resources were updated in November 2022, with mineral reserves and mineral resources increasing across all categories and by a total of 19% since completion of the feasibility study in mid-2021. Mineral reserves have increased by 260,000 ounces or 14%, while indicated mineral resources and inferred mineral resources have increased by 4% and 76% respectively.
The growth in mineral reserves and mineral resources is the result of infill drilling, the success of which has contributed to an updated mineral resource model and stope designs, with the average horizontal stope width increasing from 12.6 metres in 2021 to 13.6 metres in 2022.
The positive results support the expanded production plan at 9,000 tpd, with a gold production profile of 200,000 to 250,000 ounces per year compared to the LOM average of 169,000 ounces in the 2021 feasibility study, while maintaining a mineral reserves life of nearly 10 years.
Figure 6: Change in Proven and Probable Mineral Reserves at Wasamac
MINERAL RESERVE AND MINERAL RESOURCE ESTIMATES
Mineral Reserves (Proven and Probable)
The following table sets forth the Mineral Reserve estimates for the Company’s mineral projects as at December 31, 2022.
Gold | Proven Mineral Reserves | Probable Mineral Reserves | Total - Proven and Probable | ||||||
Tonnes | Grade | Contained | Tonnes | Grade | Contained | Tonnes | Grade | Contained | |
Canadian Malartic & Barnat Open Pit (50%) | 25,802 | 0.70 | 579 | 26,185 | 1.10 | 926 | 51,988 | 0.90 | 1,505 |
Odyssey Underground (50%) | - | - | - | 1,379 | 2.22 | 98 | 1,379 | 2.22 | 98 |
Canadian Malartic Total (50%) | 25,802 | 0.70 | 579 | 27,564 | 1.16 | 1,025 | 53,366 | 0.93 | 1,603 |
Jacobina | 24,556 | 2.19 | 1,731 | 17,943 | 2.15 | 1,241 | 42,499 | 2.18 | 2,973 |
Cerro Moro | 343 | 9.25 | 102 | 1,495 | 7.15 | 344 | 1,838 | 7.55 | 446 |
El Peñón Ore | 1,069 | 5.43 | 187 | 4,890 | 4.59 | 722 | 5,959 | 4.74 | 909 |
El Peñón Stockpiles | 6 | 2.69 | 1 | 617 | 1.09 | 22 | 623 | 1.10 | 22 |
El Peñón Total | 1,075 | 5.42 | 187 | 5,507 | 4.20 | 744 | 6,582 | 4.40 | 931 |
Minera Florida Ore | 958 | 3.29 | 101 | 2,708 | 3.33 | 290 | 3,666 | 3.32 | 392 |
Minera Florida Tailings | - | - | - | 1,375 | 0.87 | 38 | 1,375 | 0.87 | 38 |
Minera Florida Total | 958 | 3.29 | 101 | 4,082 | 2.50 | 328 | 5,041 | 2.65 | 430 |
Wasamac | - | - | - | 26,835 | 2.51 | 2,170 | 26,835 | 2.51 | 2,170 |
Jeronimo (57%) | 6,350 | 3.91 | 798 | 2,331 | 3.79 | 284 | 8,681 | 3.88 | 1,082 |
MARA (56.25%) | 330,300 | 0.25 | 2,655 | 291,150 | 0.16 | 1,498 | 621,450 | 0.21 | 4,152 |
Total Gold Mineral Reserves | 389,385 | 0.49 | 6,153 | 376,907 | 0.63 | 7,634 | 766,292 | 0.56 | 13,787 |
|
|
|
|
|
|
|
|
|
|
Silver | Proven Mineral Reserves | Probable Mineral Reserves | Total - Proven and Probable | ||||||
Tonnes | Grade | Contained | Tonnes | Grade | Contained | Tonnes | Grade | Contained | |
Cerro Moro | 343 | 531.3 | 5,855 | 1,495 | 264.5 | 12,716 | 1,838 | 314.3 | 18,571 |
El Peñón Ore | 1,069 | 214.6 | 7,379 | 4,890 | 164.3 | 25,824 | 5,959 | 173.3 | 33,203 |
El Peñón Stockpiles | 6 | 116.3 | 23 | 617 | 19.0 | 376 | 623 | 19.9 | 399 |
El Peñón Total | 1,075 | 214.1 | 7,402 | 5,507 | 148.0 | 26,200 | 6,582 | 158.8 | 33,602 |
Minera Florida Ore | 958 | 17.6 | 542 | 2,708 | 23.4 | 2,037 | 3,666 | 21.9 | 2,580 |
Minera Florida Tailings | - | - | - | 1,375 | 12.3 | 545 | 1,375 | 12.3 | 545 |
Minera Florida Total | 958 | 17.6 | 542 | 4,082 | 19.7 | 2,583 | 5,041 | 19.3 | 3,125 |
MARA (56.25%) | 330,300 | 3.0 | 32,070 | 291,150 | 2.6 | 24,618 | 621,450 | 2.8 | 56,689 |
Total Silver Mineral Reserves | 332,677 | 4.3 | 45,869 | 302,234 | 6.8 | 66,117 | 634,911 | 5.5 | 111,987 |
|
|
|
|
|
|
|
|
|
|
|
|
|
|
|
|
|
|
|
|
Copper | Proven Mineral Reserves | Probable Mineral Reserves | Total - Proven and Probable | ||||||
Tonnes | Grade | Contained | Tonnes | Grade | Contained | Tonnes | Grade | Contained | |
MARA (56.25%) | 330,300 | 0.57 | 4,151 | 291,150 | 0.39 | 2,503 | 621,450 | 0.49 | 6,654 |
Total Copper Mineral Reserves | 330,300 | 0.57 | 4,151 | 291,150 | 0.39 | 2,503 | 621,450 | 0.49 | 6,654 |
|
|
|
|
|
|
|
|
|
|
Zinc | Proven Mineral Reserves | Probable Mineral Reserves | Total - Proven and Probable | ||||||
Tonnes | Grade | Contained | Tonnes | Grade | Contained | Tonnes | Grade | Contained | |
Minera Florida Ore | 958 | 1.20 | 25 | 2,708 | 0.95 | 57 | 3,666 | 1.01 | 82 |
Minera Florida Tailings | - | - | - | 1,375 | 0.59 | 18 | 1,375 | 0.59 | 18 |
Minera Florida Total | 958 | 1.20 | 25 | 4,082 | 0.83 | 74 | 5,041 | 0.90 | 100 |
Total Zinc Mineral Reserves | 958 | 1.20 | 25 | 4,082 | 0.83 | 74 | 5,041 | 0.90 | 100 |
|
|
|
|
|
|
|
|
|
|
Molybdenum | Proven Mineral Reserves | Probable Mineral Reserves | Total - Proven and Probable | ||||||
Tonnes | Grade | Contained | Tonnes | Grade | Contained | Tonnes | Grade | Contained | |
MARA (56.25%) | 330,300 | 0.030 | 218 | 291,150 | 0.030 | 192 | 621,450 | 0.030 | 411 |
Total Molybdenum Mineral Reserves | 330,300 | 0.030 | 218 | 291,150 | 0.030 | 192 | 621,450 | 0.030 | 411 |
Mineral Resources (Measured, Indicated, and Inferred)
The following tables set forth the Mineral Resource estimates for the Company’s mineral projects as at December 31, 2022.
Gold | Measured Mineral Resources | Indicated Mineral Resources | Total - Measured and Indicated | |||||||
Tonnes | Grade | Contained | Tonnes | Grade | Contained | Tonnes | Grade | Contained | ||
Canadian Malartic, Barnat & other zones (50%) | - | - | - | - | - | - | - | - | - | |
Odyssey Underground (50%) | - | - | - | 888 | 1.59 | 46 | 888 | 1.59 | 46 | |
East Malartic Underground (50%) | - | - | - | 6,107 | 1.96 | 385 | 6,107 | 1.96 | 385 | |
East Gouldie Underground (50%) | - | - | - | 25,105 | 3.29 | 2,652 | 25,105 | 3.29 | 2,652 | |
Canadian Malartic Total (50%) | - | - | - | 32,101 | 2.99 | 3,082 | 32,101 | 2.99 | 3,082 | |
Jacobina | 34,221 | 2.35 | 2,587 | 20,845 | 2.31 | 1,548 | 55,066 | 2.34 | 4,136 | |
Cerro Moro | 170 | 5.12 | 28 | 666 | 3.58 | 77 | 836 | 3.89 | 105 | |
El Peñón Mine | 1,183 | 4.28 | 163 | 6,149 | 3.21 | 635 | 7,331 | 3.38 | 797 | |
El Peñón Tailings | - | - | - | - | - | - | - | - | - | |
El Peñón Stockpiles | - | - | - | 599 | 1.43 | 28 | 599 | 1.43 | 28 | |
El Peñón Total | 1,183 | 4.28 | 163 | 6,748 | 3.05 | 662 | 7,930 | 3.24 | 825 | |
Minera Florida | 2,729 | 4.32 | 379 | 6,238 | 3.84 | 769 | 8,968 | 3.98 | 1,149 | |
Wasamac | - | - | - | 6,034 | 1.75 | 339 | 6,034 | 1.75 | 339 | |
Jeronimo (57%) | 772 | 3.77 | 94 | 385 | 3.69 | 46 | 1,157 | 3.74 | 139 | |
Agua Rica (56.25%) | 30,150 | 0.13 | 126 | 116,044 | 0.11 | 411 | 146,194 | 0.11 | 537 | |
Alumbrera (56.25%) | 65,297 | 0.31 | 660 | 5,154 | 0.29 | 48 | 70,451 | 0.31 | 708 | |
MARA Total (56.25%) | 95,447 | 0.26 | 786 | 121,198 | 0.12 | 459 | 216,645 | 0.18 | 1,245 | |
Arco Sul | - | - | - | - | - | - | - | - | - | |
La Pepa (80%) | 47,053 | 0.61 | 920 | 52,324 | 0.49 | 831 | 99,377 | 0.55 | 1,751 | |
Lavra Velha | - | - | - | 4,476 | 1.96 | 282 | 4,476 | 1.96 | 282 | |
Monument Bay | - | - | - | 36,581 | 1.52 | 1,787 | 36,581 | 1.52 | 1,787 | |
Suyai | - | - | - | 4,700 | 15.00 | 2,286 | 4,700 | 15.00 | 2,286 | |
Total Gold M&I Mineral Resources | 181,574 | 0.85 | 4,957 | 292,297 | 1.29 | 12,170 | 473,871 | 1.12 | 17,126 | |
|
|
|
|
|
|
|
|
|
| |
|
|
|
|
|
|
|
|
|
| |
|
|
|
| |||||||
Silver | Measured Mineral Resources | Indicated Mineral Resources | Total - Measured and Indicated | |||||||
Tonnes | Grade | Contained | Tonnes | Grade | Contained | Tonnes | Grade | Contained | ||
Cerro Moro | 170 | 185.3 | 1,010 | 666 | 244.9 | 5,245 | 836 | 232.8 | 6,255 | |
El Peñón Mine | 1,183 | 145.3 | 5,523 | 6,149 | 105.9 | 20,940 | 7,331 | 112.3 | 26,463 | |
El Peñón Tailings | - | - | - | - | - | - | - | - | - | |
El Peñón Stockpiles | - | - | - | 599 | 32.9 | 633 | 599 | 32.9 | 633 | |
El Peñón Total | 1,183 | 145.3 | 5,523 | 6,748 | 99.4 | 21,574 | 7,930 | 106.3 | 27,096 | |
Minera Florida | 2,729 | 23.4 | 2,053 | 6,238 | 21.4 | 4,285 | 8,968 | 22.0 | 6,338 | |
Agua Rica (56.25%) | 30,150 | 1.6 | 1,502 | 116,044 | 1.9 | 6,940 | 146,194 | 1.8 | 8,442 | |
Alumbrera (56.25%) | - | - | - | - | - | - | - | - | - | |
MARA Total (56.25%) | 30,150 | 1.6 | 1,502 | 116,044 | 1.9 | 6,940 | 146,194 | 1.8 | 8,442 | |
Suyai | - | - | - | 4,700 | 23.0 | 3,523 | 4,700 | 23.0 | 3,523 | |
Total Silver M&I Mineral Resources | 34,231 | 9.2 | 10,089 | 134,396 | 9.6 | 41,566 | 168,627 | 9.5 | 51,654 | |
|
|
|
|
|
|
|
|
|
| |
Copper | Measured Mineral Resources | Indicated Mineral Resources | Total - Measured and Indicated | ||||||
Tonnes | Grade | Contained | Tonnes | Grade | Contained | Tonnes | Grade | Contained | |
Agua Rica (56.25%) | 30,150 | 0.22 | 146 | 116,044 | 0.30 | 767 | 146,194 | 0.28 | 914 |
Alumbrera (56.25%) | 65,297 | 0.31 | 445 | 5,154 | 0.21 | 24 | 70,451 | 0.30 | 469 |
MARA Total (56.25%) | 95,447 | 0.28 | 591 | 121,198 | 0.30 | 791 | 216,645 | 0.29 | 1,383 |
Total Copper M&I Mineral Resources | 95,447 | 0.28 | 591 | 121,198 | 0.30 | 791 | 216,645 | 0.29 | 1,383 |
|
|
|
|
|
|
|
|
|
|
Zinc | Measured Mineral Resources | Indicated Mineral Resources | Total - Measured and Indicated | ||||||
Tonnes | Grade | Contained | Tonnes | Grade | Contained | Tonnes | Grade | Contained | |
Minera Florida | 2,729 | 1.45 | 87 | 6,238 | 1.30 | 178 | 8,968 | 1.34 | 266 |
Total Zinc M&I Mineral Resources | 2,729 | 1.45 | 87 | 6,238 | 1.30 | 178 | 8,968 | 1.34 | 266 |
|
|
|
|
|
|
|
|
|
|
|
|
|
|
|
|
|
|
|
|
|
|
|
|
|
|
|
|
|
|
Molybdenum | Measured Mineral Resources | Indicated Mineral Resources | Total - Measured and Indicated | ||||||
Tonnes | Grade | Contained | Tonnes | Grade | Contained | Tonnes | Grade | Contained | |
Agua Rica (56.25%) | 30,150 | 0.020 | 14 | 116,044 | 0.030 | 77 | 146,194 | 0.030 | 90 |
Alumbrera (56.25%) | 65,297 | 0.012 | 16 | 5,154 | 0.010 | 1 | 70,451 | 0.011 | 17 |
MARA Total (56.25%) | 95,447 | 0.014 | 30 | 121,198 | 0.029 | 78 | 216,645 | 0.022 | 107 |
Total Molybdenum M&I Mineral Resources | 95,447 | 0.014 | 30 | 121,198 | 0.029 | 78 | 216,645 | 0.022 | 107 |
Gold | Inferred Mineral Resources | ||
Tonnes | Grade | Contained | |
Canadian Malartic, Barnat & other zones (50%) | 2,804 | 0.73 | 66 |
Odyssey Underground (50%) | 11,250 | 2.18 | 787 |
East Malartic Underground (50%) | 38,781 | 2.01 | 2,510 |
East Gouldie Underground (50%) | 16,189 | 2.54 | 1,320 |
Canadian Malartic Total (50%) | 69,025 | 2.11 | 4,682 |
Jacobina | 26,347 | 2.28 | 1,934 |
Cerro Moro | 1,095 | 5.98 | 210 |
El Peñón Mine | 4,714 | 3.72 | 564 |
El Peñón Tailings | 13,767 | 0.55 | 245 |
El Peñón Stockpiles | - | - | - |
El Peñón Total | 18,480 | 1.36 | 808 |
Minera Florida | 4,224 | 4.63 | 629 |
Wasamac | 7,086 | 2.00 | 455 |
Jeronimo (57%) | 1,118 | 4.49 | 161 |
Agua Rica (56.25%) | 417,881 | 0.09 | 1,209 |
Alumbrera (56.25%) | 1,708 | 0.23 | 13 |
MARA Total (56.25%) | 419,590 | 0.09 | 1,222 |
Arco Sul | 6,203 | 3.08 | 615 |
La Pepa (80%) | 20,019 | 0.46 | 293 |
Lavra Velha | 4,745 | 1.56 | 238 |
Monument Bay | 41,946 | 1.32 | 1,781 |
Suyai | 900 | 9.90 | 274 |
Total Gold Inferred Mineral Resources | 620,778 | 0.67 | 13,302 |
|
|
|
|
|
|
|
|
|
|
|
|
|
|
|
|
Silver | Inferred Mineral Resources | ||
Tonnes | Grade | Contained | |
Cerro Moro | 1,095 | 144.2 | 5,076 |
El Peñón Mine | 4,714 | 143.3 | 21,722 |
El Peñón Tailings | 13,767 | 18.9 | 8,380 |
El Peñón Stockpiles | - | - | - |
El Peñón Total | 18,480 | 50.7 | 30,103 |
Minera Florida | 4,224 | 18.4 | 2,494 |
Agua Rica (56.25%) | 417,881 | 1.6 | 21,765 |
Alumbrera (56.25%) | - | - | - |
MARA Total (56.25%) | 417,881 | 1.6 | 21,765 |
Suyai | 900 | 21.0 | 575 |
Total Silver Inferred Mineral Resources | 442,580 | 4.2 | 60,013 |
|
|
|
|
Copper | Inferred Mineral Resources | ||
Tonnes | Grade | Contained | |
Agua Rica (56.25%) | 417,881 | 0.23 | 2,119 |
Alumbrera (56.25%) | 1,708 | 0.17 | 6 |
MARA Total (56.25%) | 419,590 | 0.23 | 2,125 |
Total Copper Inferred Mineral Resources | 419,590 | 0.23 | 2,125 |
|
|
|
|
Zinc | Inferred Mineral Resources | ||
Tonnes | Grade | Contained | |
Minera Florida | 4,224 | 1.27 | 118 |
Total Zinc Inferred Mineral Resources | 4,224 | 1.27 | 118 |
|
|
|
|
Molybdenum | Inferred Mineral Resources | ||
Tonnes | Grade | Contained | |
Agua Rica (56.25%) | 417,881 | 0.030 | 276 |
Alumbrera (56.25%) | 1,708 | 0.008 | 1 |
MARA Total (56.25%) | 419,590 | 0.030 | 277 |
Total Molybdenum Inferred Mineral Resources | 419,590 | 0.030 | 277 |
Mineral Reserve and Mineral Resource Reporting Notes
1. Metal Price, Cut-off Grade, Metallurgical Recovery | |||
| Mineral Reserves | Mineral Resources | |
Canadian Malartic (50%) | Price assumption: $1,300/oz gold | Price assumption: $1,667/oz gold | |
|
|
| |
Jacobina | Price assumption: $1,250/oz gold | Price assumption: $1,250/oz gold. Cut-off grades correspond to 75% of the cut-off used to estimate the Mineral Reserves | |
|
|
| |
Cerro Moro | Price assumptions: $1,250/oz gold and $18.00/oz silver | Price assumptions: $1,250/oz gold and $18.00/oz silver. NSR cut-off values correspond to 75% of Mineral Reserves cut-off | |
|
|
| |
El Peñón | Price assumptions: $1,250/oz gold, $18.00 silver | Price assumptions: $1,250/oz gold, $18.00/oz silver | |
|
|
| |
Minera Florida | Price assumptions: $1,250/oz gold, $18.00/oz silver and $1.25/lb zinc | Price assumptions: $1,250/oz gold, $18.00/oz silver and $1.25/lb zinc | |
|
| ||
Wasamac | Price assumption: $1,250/oz gold using an exchange rate of US$1.32:C$1.00 | Price assumption: $1,250/oz gold. Cut-off grades correspond to 75% of the cut-off used to estimate the Mineral Reserves | |
|
|
| |
Jeronimo (57%) | Price assumption:$900/oz gold | Cut-off grade at 2.0 g/t gold | |
|
|
| |
MARA: Agua Rica (56.25%) | Mineral Reserves are estimated using a variable metallurgical recovery | Mineral Resources are estimated using a variable metallurgical recovery | |
|
|
| |
MARA: Alumbrera (56.25%) | N/A | Price assumptions: $1,300/oz gold, $2.83/lb copper. | |
|
|
| |
Arco Sul | N/A | Price assumption: $1,250/oz gold | |
|
|
| |
La Pepa (80%) | N/A | Price assumption: $1,650/oz gold | |
|
|
| |
Lavra Velha | N/A | Price assumption: $1,650/oz gold | |
|
| ||
|
|
| |
Monument Bay | N/A | Price Assumption: $1,200/oz gold | |
|
|
| |
Suyai | N/A | 5.0 g/t gold cut-off inside mineralized wireframe modeling | |
|
|
| |
2. All Mineral Reserves and Mineral Resources have been estimated in accordance with the standards of the Canadian Institute of Mining, Metallurgy and Petroleum (“CIM”) and National Instrument 43-101 – Standards of Disclosure for Mineral Projects (“NI 43-101”). | |||
3. All Mineral Resources are reported exclusive of Mineral Reserves. | |||
4. Mineral Resources which are not Mineral Reserves do not have demonstrated economic viability. | |||
5. Mineral Reserves and Mineral Resources are reported as of December 31, 2022. | |||
6. For the qualified persons responsible for the Mineral Reserve and Mineral Resource estimates at the Company’s material properties, see the qualified persons list below: | |||
Property | Qualified Persons for Mineral Reserves | Qualified Persons for Mineral Resources | |
Canadian Malartic | Patrick Fiset, Eng., and Pierre-Olivier Richard, Eng., Canadian Malartic GP | Pascal Lehouiller, P. Geo, Canadian Malartic GP | |
Jacobina | Eduardo de Souza Soares, MAusIMM CP (Min), Yamana Gold Inc. | Camila Passos, P. Geo, and Danilo Ribeiro dos Santos, MAusIMM CP (Geo), Yamana Gold Inc. | |
El Peñón | Jimmy Avendaño Gonzalez, Registered Member of the Chilean Mining Commission, Yamana Gold Inc. | Marco Velásquez Corrales, Registered Member of the Chilean Mining Commission, Yamana Gold Inc. | |
Qualified Persons
Scientific and technical information contained in this news release has been reviewed and approved by Sébastien Bernier (P. Geo and Senior Director, Reserves and Resources). Sébastien Bernier is an employee of Yamana Gold Inc. and a "Qualified Person" as defined by NI 43-101. Data verification related to certain scientific and technical information disclosed herein in connection with Yamana’s material properties can be found in the Company’s technical reports entitled “NI 43-101 Technical Report, El Peñón Gold-Silver Mine, Antofagasta Region, Chile” and dated effective December 31, 2020, “NI 43-101 Technical Report, Jacobina Gold Mine, Bahia State, Brazil” and dated effective December 31, 2019, “NI 43-101 Technical Report, Canadian Malartic Mine, Quebec, Canada” and dated effective December 31, 2020, “Technical Report on the Agua Rica Integrated Project, Catamarca Province, Argentina” and dated effective June 30, 2019, “NI 43-101 Technical Report on the Wasamac Feasibility Study Update" and dated effective July 16, 2021, “NI 43-101 Technical Report, Cerro Moro Gold-Silver Mine, Santa Cruz Province, Argentina” and dated effective December 31, 2021, and “NI 43-101 Technical Report, Minera Florida Gold-Silver Mine, Metropolitan Region, Chile” and dated effective December 31, 2021 available under the Company’s profile on SEDAR at www.sedar.com and on the Company’s website.
About Yamana
Yamana Gold Inc. is a Canadian-based precious metals producer with significant gold and silver production, development stage properties, exploration properties, and land positions throughout the Americas, including Canada, Brazil, Chile and Argentina.
FOR FURTHER INFORMATION PLEASE CONTACT:
Investor Relations
416-815-0220
1-888-809-0925
Email: investor@yamana.com
FTI Consulting (UK Public Relations)
Sara Powell / Ben Brewerton
+44 7974 201 715223 / +44 203 727 1000
END NOTES
(1) GEO is calculated as the sum of gold ounces and gold equivalent silver ounces using a ratio of 82.94 for the year-ended December 31, 2022. GEO reserve calculations are based on mineral reserves metal price assumptions of $1,250 per ounce of gold and $18 per ounce of silver, and metallurgical recoveries specific to the mine plan. Guidance GEO assumes gold ounces plus the equivalent of silver ounces using a ratio of 72.00.
(2) A cautionary note regarding non-GAAP performance measures and their respective reconciliations, as well as additional line items or subtotals in financial statements is included in Section 12: Non-GAAP Performance Measures and Additional Subtotals in Financial Statements in the Company's MD&A for the three and twelve months ended December 31, 2022, dated March 29, 2023, available under the Company’s profile on SEDAR at www.sedar.com and on the Company’s website.
CAUTIONARY NOTE REGARDING FORWARD-LOOKING STATEMENTS: This news release contains or incorporates by reference “forward-looking statements” and “forward-looking information” under applicable Canadian securities legislation and within the meaning of the United States Private Securities Litigation Reform Act of 1995. Forward-looking information includes, but is not limited to information with respect to expected timing for completion of the Proposed Transaction, expectations for AISC, information with respect to the Company’s strategy, plans, expectations, beliefs, including future operating performance and updates regarding mineral reserves and mineral resources. Forward-looking statements are characterized by words such as “plan", “expect”, “budget”, “target”, “project”, “intend”, “believe”, “anticipate”, “estimate” and other similar words, or statements that certain events or conditions “may” or “will” occur. Forward-looking statements are based on the opinions, assumptions and estimates of management considered reasonable at the date the statements are made, and are inherently subject to a variety of risks and uncertainties and other known and unknown factors that could cause actual events or results to differ materially from those projected in the forward-looking statements. These factors include transaction risks, risks relating to the completion of the Proposed Transaction on the timeline anticipated or at all, the Company’s expectations in connection with the production and exploration, development and expansion plans at the Company's projects discussed herein being met, the impact of proposed optimizations at the Company's projects, the impact of any variance in the Company’s current plans made by Pan American and/or Agnico Eagle Mines Limited post-closing of the Proposed Transaction, changes in national and local government legislation, taxation, controls or regulations and/or change in the administration of laws, policies and practices, and the impact of general business and economic conditions, global liquidity and credit availability on the timing of cash flows and the values of assets and liabilities based on projected future conditions, fluctuating metal prices (such as gold, silver, copper and zinc), currency exchange rates (such as the Canadian Dollar, the Brazilian Real, the Chilean Peso and the Argentine Peso versus the United States Dollar), the impact of inflation, possible variations in ore grade or recovery rates, changes in the Company’s hedging program, changes in accounting policies, changes in mineral resources and mineral reserves, risks related to asset dispositions, risks related to metal purchase agreements, risks related to acquisitions, changes in project parametres as plans continue to be refined, changes in project development, construction, production and commissioning time frames, risks associated with infectious diseases, including COVID-19, unanticipated costs and expenses, higher prices for fuel, steel, power, labour and other consumables contributing to higher costs and general risks of the mining industry, failure of plant, equipment or processes to operate as anticipated, unexpected changes in mine life, final pricing for concentrate sales, unanticipated results of future studies, seasonality and unanticipated weather changes, costs and timing of the development of new deposits, success of exploration activities, permitting timelines, government regulation and the risk of government expropriation or nationalization of mining operations, risks related to relying on local advisors and consultants in foreign jurisdictions, environmental risks, unanticipated reclamation expenses, risks relating to joint venture operations, title disputes or claims, limitations on insurance coverage, timing and possible outcome of pending and outstanding litigation and labour disputes, risks related to enforcing legal rights in foreign jurisdictions, as well as those risk factors discussed or referred to herein, in the management information circular in connection with the Proposed Transaction and in the Company's Annual Information Form filed with the securities regulatory authorities in all provinces of Canada and available at www.sedar.com, and the Company’s Annual Report on Form 40-F filed with the United States Securities and Exchange Commission. Although the Company has attempted to identify important factors that could cause actual actions, events or results to differ materially from those described in forward-looking statements, there may be other factors that cause actions, events or results not to be anticipated, estimated or intended. There can be no assurance that forward-looking statements will prove to be accurate, as actual results and future events could differ materially from those anticipated in such statements. The Company undertakes no obligation to update forward-looking statements if circumstances or management’s estimates, assumptions or opinions should change, except as required by applicable law. The reader is cautioned not to place undue reliance on forward-looking statements. The reader is cautioned not to place undue reliance on forward-looking statements. The forward-looking information contained herein is presented for the purpose of assisting investors in understanding the Company’s expected operational performance and results as at and for the periods ended on the dates presented in the Company’s plans and objectives and may not be appropriate for other purposes.
CAUTIONARY NOTE TO UNITED STATES INVESTORS CONCERNING ESTIMATES OF MEASURED, INDICATED AND INFERRED MINERAL RESOURCES
This news release has been prepared in accordance with the requirements of the securities laws in effect in Canada, which differ in certain material respects from the disclosure requirements promulgated by the Securities and Exchange Commission (the “SEC”). For example, the terms “mineral reserve”, “proven mineral reserve”, “probable mineral reserve”, “mineral resource”, “measured mineral resource”, “indicated mineral resource” and “inferred mineral resource” are Canadian mining terms as defined in accordance with NI 43-101 and the CIM Definition Standards on Mineral Resources and Mineral Reserves, adopted by the CIM Council, as amended. These definitions differ from the definitions in the disclosure requirements promulgated by the SEC. Accordingly, information contained in this news release may not be comparable to similar information made public by U.S. companies reporting pursuant to SEC disclosure requirements.
Figures accompanying this announcement are available at:
https://www.globenewswire.com/NewsRoom/AttachmentNg/29533fb9-89a7-45c7-98ed-2583583f8156
https://www.globenewswire.com/NewsRoom/AttachmentNg/6b455d4d-646d-41eb-adf3-a0f52e43b154
https://www.globenewswire.com/NewsRoom/AttachmentNg/8e6c8003-81da-40c3-bcdf-7cde58515cf5
https://www.globenewswire.com/NewsRoom/AttachmentNg/59230e2f-86cf-466b-a309-427f87eafeda
https://www.globenewswire.com/NewsRoom/AttachmentNg/ce394a34-39a0-44b6-870a-f98fe6e58113
https://www.globenewswire.com/NewsRoom/AttachmentNg/a09179b2-fe55-442a-8e85-faed9f18690b

