
 Yahoo Finance
 What Is WSP Global's (TSE:WSP) P/E Ratio After Its Share Price Tanked?

To the annoyance of some shareholders, WSP Global (TSE:WSP) shares are down a considerable 33% in the last month. Even longer term holders have taken a real hit with the stock declining 8.3% in the last year.
All else being equal, a share price drop should make a stock more attractive to potential investors. While the market sentiment towards a stock is very changeable, in the long run, the share price will tend to move in the same direction as earnings per share. So, on certain occasions, long term focussed investors try to take advantage of pessimistic expectations to buy shares at a better price. Perhaps the simplest way to get a read on investors' expectations of a business is to look at its Price to Earnings Ratio (PE Ratio). A high P/E ratio means that investors have a high expectation about future growth, while a low P/E ratio means they have low expectations about future growth.
See our latest analysis for WSP Global
Does WSP Global Have A Relatively High Or Low P/E For Its Industry?
We can tell from its P/E ratio of 23.95 that there is some investor optimism about WSP Global. As you can see below, WSP Global has a higher P/E than the average company (12.0) in the construction industry.
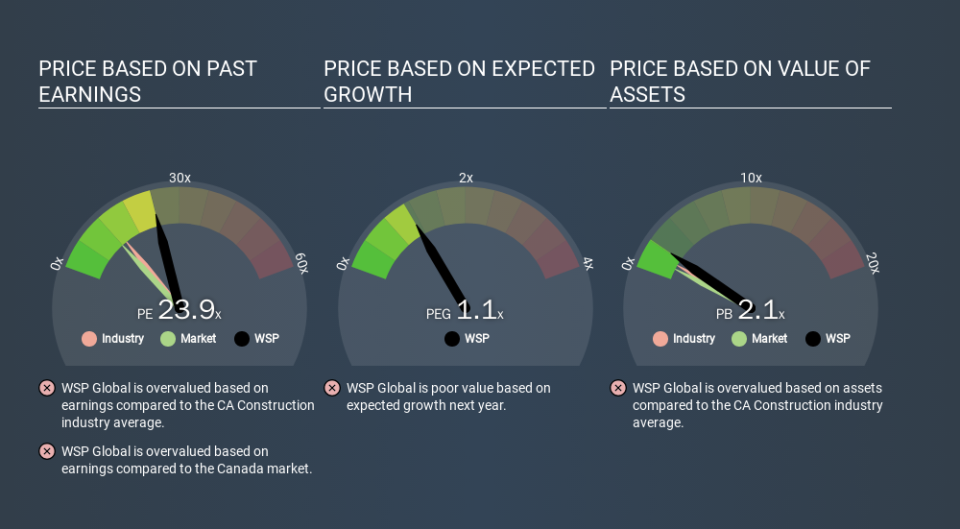
WSP Global's P/E tells us that market participants think the company will perform better than its industry peers, going forward. The market is optimistic about the future, but that doesn't guarantee future growth. So investors should delve deeper. I like to check if company insiders have been buying or selling.
How Growth Rates Impact P/E Ratios
Probably the most important factor in determining what P/E a company trades on is the earnings growth. That's because companies that grow earnings per share quickly will rapidly increase the 'E' in the equation. And in that case, the P/E ratio itself will drop rather quickly. Then, a lower P/E should attract more buyers, pushing the share price up.
WSP Global increased earnings per share by an impressive 14% over the last twelve months. And it has bolstered its earnings per share by 23% per year over the last five years. This could arguably justify a relatively high P/E ratio.
Remember: P/E Ratios Don't Consider The Balance Sheet
It's important to note that the P/E ratio considers the market capitalization, not the enterprise value. So it won't reflect the advantage of cash, or disadvantage of debt. Theoretically, a business can improve its earnings (and produce a lower P/E in the future) by investing in growth. That means taking on debt (or spending its cash).
While growth expenditure doesn't always pay off, the point is that it is a good option to have; but one that the P/E ratio ignores.
How Does WSP Global's Debt Impact Its P/E Ratio?
WSP Global has net debt worth 16% of its market capitalization. It would probably deserve a higher P/E ratio if it was net cash, since it would have more options for growth.
The Verdict On WSP Global's P/E Ratio
WSP Global has a P/E of 23.9. That's higher than the average in its market, which is 11.1. The company is not overly constrained by its modest debt levels, and its recent EPS growth very solid. So on this analysis it seems reasonable that its P/E ratio is above average. What can be absolutely certain is that the market has become significantly less optimistic about WSP Global over the last month, with the P/E ratio falling from 35.5 back then to 23.9 today. For those who prefer to invest with the flow of momentum, that might be a bad sign, but for a contrarian, it may signal opportunity.
Investors should be looking to buy stocks that the market is wrong about. If the reality for a company is better than it expects, you can make money by buying and holding for the long term. So this free visualization of the analyst consensus on future earnings could help you make the right decision about whether to buy, sell, or hold.
But note: WSP Global may not be the best stock to buy. So take a peek at this free list of interesting companies with strong recent earnings growth (and a P/E ratio below 20).
If you spot an error that warrants correction, please contact the editor at editorial-team@simplywallst.com. This article by Simply Wall St is general in nature. It does not constitute a recommendation to buy or sell any stock, and does not take account of your objectives, or your financial situation. Simply Wall St has no position in the stocks mentioned.
We aim to bring you long-term focused research analysis driven by fundamental data. Note that our analysis may not factor in the latest price-sensitive company announcements or qualitative material. Thank you for reading.
