
 Yahoo Finance
 Should You Worry About TTM Technologies, Inc.'s (NASDAQ:TTMI) CEO Pay?
In 2014 Tom Edman was appointed CEO of TTM Technologies, Inc. (NASDAQ:TTMI). This analysis aims first to contrast CEO compensation with other companies that have similar market capitalization. Then we'll look at a snap shot of the business growth. Third, we'll reflect on the total return to shareholders over three years, as a second measure of business performance. The aim of all this is to consider the appropriateness of CEO pay levels.
View our latest analysis for TTM Technologies
How Does Tom Edman's Compensation Compare With Similar Sized Companies?
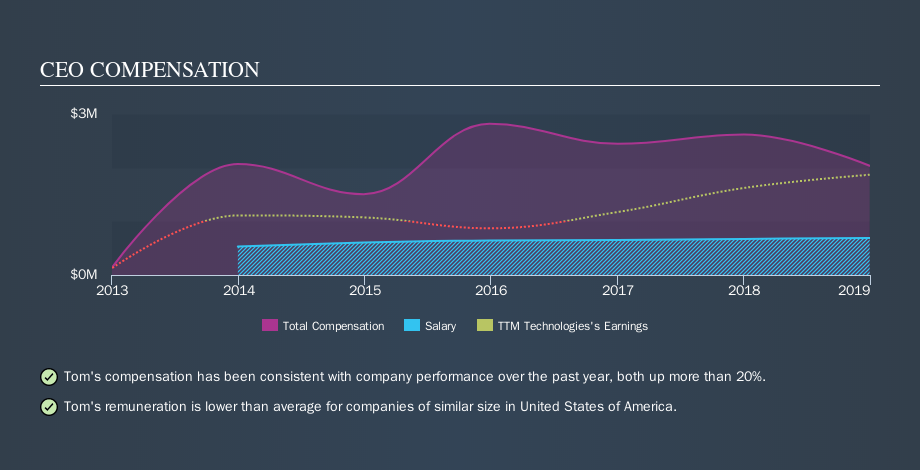
At the time of writing, our data says that TTM Technologies, Inc. has a market cap of US$1.2b, and reported total annual CEO compensation of US$2.0m for the year to December 2018. While we always look at total compensation first, we note that the salary component is less, at US$689k. Importantly, there may be performance hurdles relating to the non-salary component of the total compensation. As part of our analysis we looked at companies in the same jurisdiction, with market capitalizations of US$1.0b to US$3.2b. The median total CEO compensation was US$4.1m.
A first glance this seems like a real positive for shareholders, since Tom Edman is paid less than the average total compensation paid by similar sized companies. However, before we heap on the praise, we should delve deeper to understand business performance.
The graphic below shows how CEO compensation at TTM Technologies has changed from year to year.
Is TTM Technologies, Inc. Growing?
TTM Technologies, Inc. has increased its earnings per share (EPS) by an average of 42% a year, over the last three years (using a line of best fit). In the last year, its revenue is down 2.4%.
Overall this is a positive result for shareholders, showing that the company has improved in recent years. The lack of revenue growth isn't ideal, but it is the bottom line that counts most in business. Shareholders might be interested in this free visualization of analyst forecasts.
Has TTM Technologies, Inc. Been A Good Investment?
TTM Technologies, Inc. has generated a total shareholder return of 1.1% over three years, so most shareholders wouldn't be too disappointed. But they would probably prefer not to see CEO compensation far in excess of the median.
In Summary...
It looks like TTM Technologies, Inc. pays its CEO less than similar sized companies.
Considering the underlying business is growing earnings, this would suggest the pay is modest. While returns over the last few years haven't been top notch, there is nothing to suggest to us that Tom Edman is overcompensated. It's great to see a company that pays its CEO reasonably, even while growing. But it would be nice if insiders were also buying shares. If you think CEO compensation levels are interesting you will probably really like this free visualization of insider trading at TTM Technologies.
Important note: TTM Technologies may not be the best stock to buy. You might find something better in this list of interesting companies with high ROE and low debt.
We aim to bring you long-term focused research analysis driven by fundamental data. Note that our analysis may not factor in the latest price-sensitive company announcements or qualitative material.
If you spot an error that warrants correction, please contact the editor at editorial-team@simplywallst.com. This article by Simply Wall St is general in nature. It does not constitute a recommendation to buy or sell any stock, and does not take account of your objectives, or your financial situation. Simply Wall St has no position in the stocks mentioned. Thank you for reading.
