
 Yahoo Finance
 Should We Worry About Loblaw Companies Limited's (TSE:L) P/E Ratio?

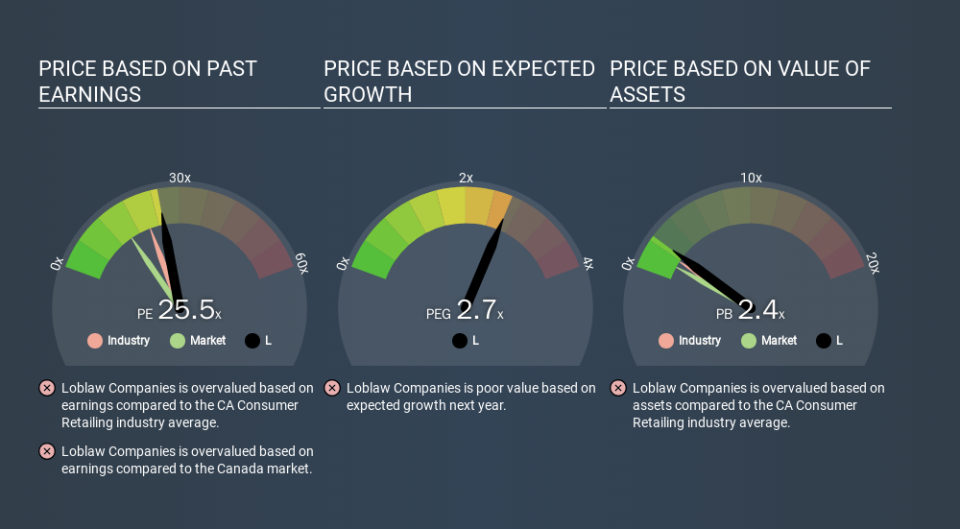
Today, we'll introduce the concept of the P/E ratio for those who are learning about investing. To keep it practical, we'll show how Loblaw Companies Limited's (TSE:L) P/E ratio could help you assess the value on offer. Loblaw Companies has a price to earnings ratio of 25.48, based on the last twelve months. In other words, at today's prices, investors are paying CA$25.48 for every CA$1 in prior year profit.
Check out our latest analysis for Loblaw Companies
How Do I Calculate Loblaw Companies's Price To Earnings Ratio?
The formula for P/E is:
Price to Earnings Ratio = Price per Share ÷ Earnings per Share (EPS)
Or for Loblaw Companies:
P/E of 25.48 = CA$72.10 ÷ CA$2.83 (Based on the trailing twelve months to October 2019.)
Is A High Price-to-Earnings Ratio Good?
The higher the P/E ratio, the higher the price tag of a business, relative to its trailing earnings. That isn't necessarily good or bad, but a high P/E implies relatively high expectations of what a company can achieve in the future.
Does Loblaw Companies Have A Relatively High Or Low P/E For Its Industry?
The P/E ratio indicates whether the market has higher or lower expectations of a company. You can see in the image below that the average P/E (21.4) for companies in the consumer retailing industry is lower than Loblaw Companies's P/E.
Its relatively high P/E ratio indicates that Loblaw Companies shareholders think it will perform better than other companies in its industry classification. The market is optimistic about the future, but that doesn't guarantee future growth. So investors should delve deeper. I like to check if company insiders have been buying or selling.
How Growth Rates Impact P/E Ratios
Generally speaking the rate of earnings growth has a profound impact on a company's P/E multiple. Earnings growth means that in the future the 'E' will be higher. That means unless the share price increases, the P/E will reduce in a few years. A lower P/E should indicate the stock is cheap relative to others -- and that may attract buyers.
Loblaw Companies's earnings made like a rocket, taking off 275% last year. Having said that, the average EPS growth over the last three years wasn't so good, coming in at 10%.
Don't Forget: The P/E Does Not Account For Debt or Bank Deposits
It's important to note that the P/E ratio considers the market capitalization, not the enterprise value. So it won't reflect the advantage of cash, or disadvantage of debt. In theory, a company can lower its future P/E ratio by using cash or debt to invest in growth.
Such expenditure might be good or bad, in the long term, but the point here is that the balance sheet is not reflected by this ratio.
So What Does Loblaw Companies's Balance Sheet Tell Us?
Loblaw Companies has net debt equal to 26% of its market cap. You'd want to be aware of this fact, but it doesn't bother us.
The Verdict On Loblaw Companies's P/E Ratio
Loblaw Companies trades on a P/E ratio of 25.5, which is above its market average of 15.3. While the company does use modest debt, its recent earnings growth is superb. So on this analysis a high P/E ratio seems reasonable.
Investors have an opportunity when market expectations about a stock are wrong. People often underestimate remarkable growth -- so investors can make money when fast growth is not fully appreciated. So this free visual report on analyst forecasts could hold the key to an excellent investment decision.
Of course, you might find a fantastic investment by looking at a few good candidates. So take a peek at this free list of companies with modest (or no) debt, trading on a P/E below 20.
If you spot an error that warrants correction, please contact the editor at editorial-team@simplywallst.com. This article by Simply Wall St is general in nature. It does not constitute a recommendation to buy or sell any stock, and does not take account of your objectives, or your financial situation. Simply Wall St has no position in the stocks mentioned.
We aim to bring you long-term focused research analysis driven by fundamental data. Note that our analysis may not factor in the latest price-sensitive company announcements or qualitative material. Thank you for reading.
