
 Yahoo Finance
 Should We Worry About Kirby Corporation's (NYSE:KEX) P/E Ratio?

This article is written for those who want to get better at using price to earnings ratios (P/E ratios). We'll show how you can use Kirby Corporation's (NYSE:KEX) P/E ratio to inform your assessment of the investment opportunity. Looking at earnings over the last twelve months, Kirby has a P/E ratio of 46.64. In other words, at today's prices, investors are paying $46.64 for every $1 in prior year profit.
View our latest analysis for Kirby
How Do I Calculate A Price To Earnings Ratio?
The formula for P/E is:
Price to Earnings Ratio = Share Price ÷ Earnings per Share (EPS)
Or for Kirby:
P/E of 46.64 = $89.73 ÷ $1.92 (Based on the year to September 2019.)
Is A High P/E Ratio Good?
A higher P/E ratio means that buyers have to pay a higher price for each $1 the company has earned over the last year. That isn't a good or a bad thing on its own, but a high P/E means that buyers have a higher opinion of the business's prospects, relative to stocks with a lower P/E.
Does Kirby Have A Relatively High Or Low P/E For Its Industry?
One good way to get a quick read on what market participants expect of a company is to look at its P/E ratio. You can see in the image below that the average P/E (20.7) for companies in the shipping industry is lower than Kirby's P/E.
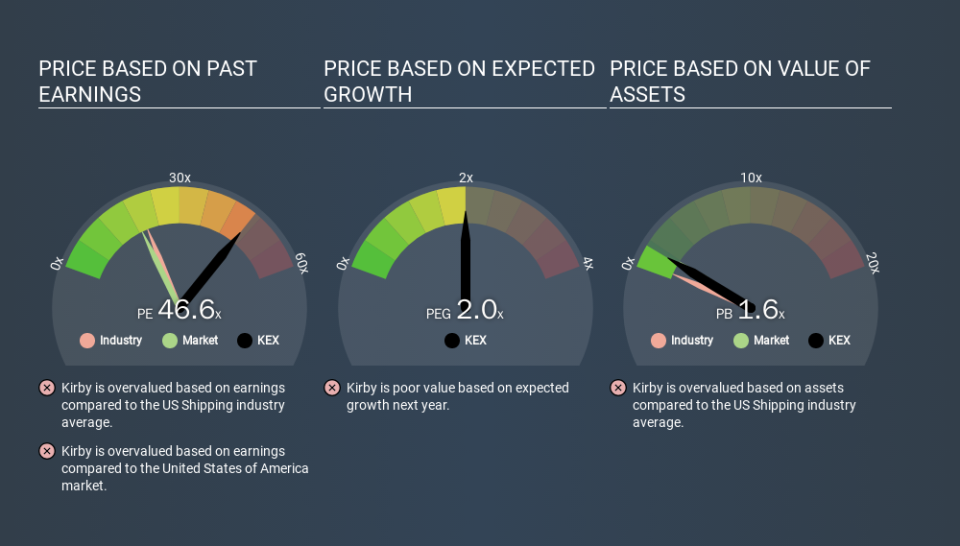
Kirby's P/E tells us that market participants think the company will perform better than its industry peers, going forward. The market is optimistic about the future, but that doesn't guarantee future growth. So further research is always essential. I often monitor director buying and selling.
How Growth Rates Impact P/E Ratios
Companies that shrink earnings per share quickly will rapidly decrease the 'E' in the equation. That means unless the share price falls, the P/E will increase in a few years. A higher P/E should indicate the stock is expensive relative to others -- and that may encourage shareholders to sell.
Kirby shrunk earnings per share by 66% over the last year. And it has shrunk its earnings per share by 17% per year over the last five years. This growth rate might warrant a below average P/E ratio.
A Limitation: P/E Ratios Ignore Debt and Cash In The Bank
The 'Price' in P/E reflects the market capitalization of the company. That means it doesn't take debt or cash into account. Hypothetically, a company could reduce its future P/E ratio by spending its cash (or taking on debt) to achieve higher earnings.
Such expenditure might be good or bad, in the long term, but the point here is that the balance sheet is not reflected by this ratio.
So What Does Kirby's Balance Sheet Tell Us?
Net debt is 26% of Kirby's market cap. You'd want to be aware of this fact, but it doesn't bother us.
The Bottom Line On Kirby's P/E Ratio
Kirby has a P/E of 46.6. That's higher than the average in its market, which is 18.7. With some debt but no EPS growth last year, the market has high expectations of future profits.
Investors have an opportunity when market expectations about a stock are wrong. If the reality for a company is better than it expects, you can make money by buying and holding for the long term. So this free report on the analyst consensus forecasts could help you make a master move on this stock.
Of course, you might find a fantastic investment by looking at a few good candidates. So take a peek at this free list of companies with modest (or no) debt, trading on a P/E below 20.
If you spot an error that warrants correction, please contact the editor at editorial-team@simplywallst.com. This article by Simply Wall St is general in nature. It does not constitute a recommendation to buy or sell any stock, and does not take account of your objectives, or your financial situation. Simply Wall St has no position in the stocks mentioned.
We aim to bring you long-term focused research analysis driven by fundamental data. Note that our analysis may not factor in the latest price-sensitive company announcements or qualitative material. Thank you for reading.
