
 Yahoo Finance
 Should You Worry About Centennial Resource Development, Inc.'s (NASDAQ:CDEV) CEO Salary Level?

Mark Papa became the CEO of Centennial Resource Development, Inc. (NASDAQ:CDEV) in 2015. This analysis aims first to contrast CEO compensation with other companies that have similar market capitalization. Next, we'll consider growth that the business demonstrates. And finally we will reflect on how common stockholders have fared in the last few years, as a secondary measure of performance. This method should give us information to assess how appropriately the company pays the CEO.
See our latest analysis for Centennial Resource Development
How Does Mark Papa's Compensation Compare With Similar Sized Companies?
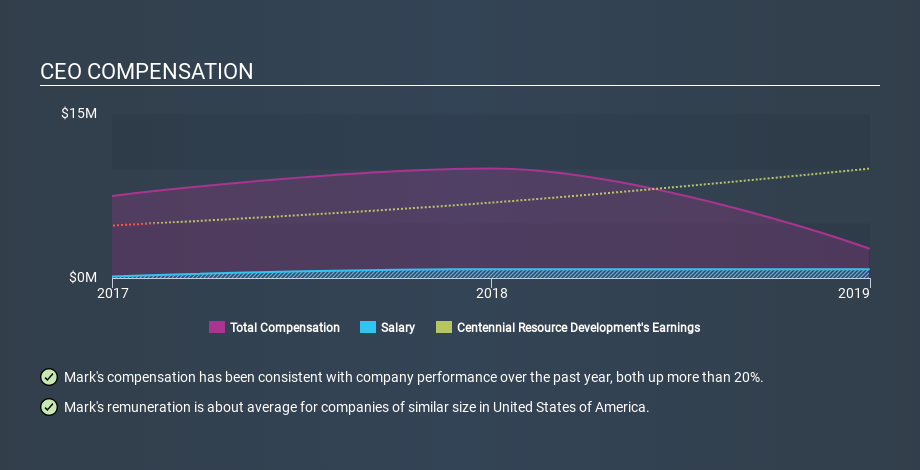
According to our data, Centennial Resource Development, Inc. has a market capitalization of US$643m, and paid its CEO total annual compensation worth US$2.7m over the year to December 2018. While we always look at total compensation first, we note that the salary component is less, at US$799k. We further remind readers that the CEO may face performance requirements to receive the non-salary part of the total compensation. When we examined a selection of companies with market caps ranging from US$400m to US$1.6b, we found the median CEO total compensation was US$2.6m.
So Mark Papa receives a similar amount to the median CEO pay, amongst the companies we looked at. This doesn't tell us a whole lot on its own, but looking at the performance of the actual business will give us useful context.
You can see a visual representation of the CEO compensation at Centennial Resource Development, below.
Is Centennial Resource Development, Inc. Growing?
Centennial Resource Development, Inc. has increased its earnings per share (EPS) by an average of 20% a year, over the last three years (using a line of best fit). Its revenue is up 6.0% over last year.
This shows that the company has improved itself over the last few years. Good news for shareholders. It's good to see a bit of revenue growth, as this suggests the business is able to grow sustainably. You might want to check this free visual report on analyst forecasts for future earnings.
Has Centennial Resource Development, Inc. Been A Good Investment?
Given the total loss of 87% over three years, many shareholders in Centennial Resource Development, Inc. are probably rather dissatisfied, to say the least. This suggests it would be unwise for the company to pay the CEO too generously.
In Summary...
Mark Papa is paid around what is normal the leaders of comparable size companies.
We'd say the company can boast of its EPS growth, but it's disappointing to see negative shareholder returns over three years. Considering the the positives we don't think the CEO pays is too high, but it's certainly hard to argue it is too low. CEO compensation is one thing, but it is also interesting to check if the CEO is buying or selling Centennial Resource Development (free visualization of insider trades).
Arguably, business quality is much more important than CEO compensation levels. So check out this free list of interesting companies, that have HIGH return on equity and low debt.
If you spot an error that warrants correction, please contact the editor at editorial-team@simplywallst.com. This article by Simply Wall St is general in nature. It does not constitute a recommendation to buy or sell any stock, and does not take account of your objectives, or your financial situation. Simply Wall St has no position in the stocks mentioned.
We aim to bring you long-term focused research analysis driven by fundamental data. Note that our analysis may not factor in the latest price-sensitive company announcements or qualitative material. Thank you for reading.
