
 Yahoo Finance
 Should You Worry About 3P Learning Limited’s (ASX:3PL) CEO Salary Level?

Rebekah O’Flaherty became the CEO of 3P Learning Limited (ASX:3PL) in 2016. This report will, first, examine the CEO compensation levels in comparison to CEO compensation at companies of similar size. Then we’ll look at a snap shot of the business growth. And finally – as a second measure of performance – we will look at the returns shareholders have received over the last few years. The aim of all this is to consider the appropriateness of CEO pay levels.
See our latest analysis for 3P Learning
Want to help shape the future of investing tools and platforms? Take the survey and be part of one of the most advanced studies of stock market investors to date.
How Does Rebekah O’Flaherty’s Compensation Compare With Similar Sized Companies?
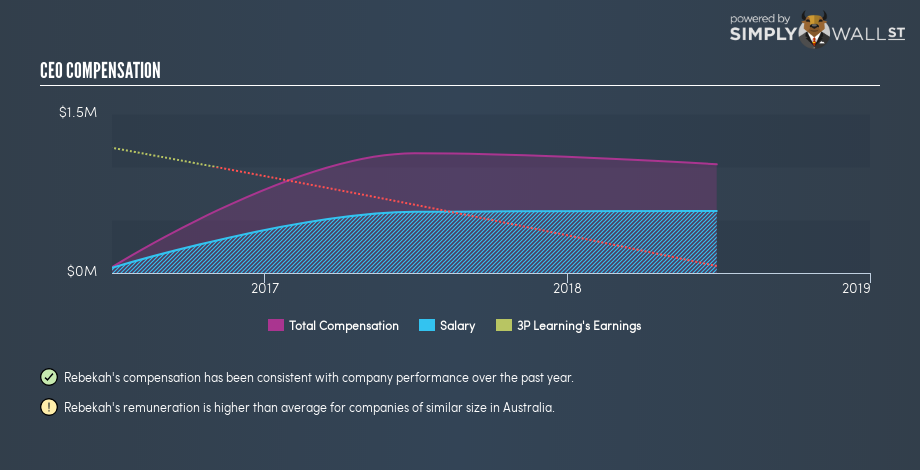
Our data indicates that 3P Learning Limited is worth AU$166m, and total annual CEO compensation is AU$1.0m. (This figure is for the year to 2018). While we always look at total compensation first, we note that the salary component is less, at AU$585k. We took a group of companies with market capitalizations below AU$278m, and calculated the median CEO compensation to be AU$364k.
Thus we can conclude that Rebekah O’Flaherty receives more in total compensation than the median of a group of companies in the same market, and of similar size to 3P Learning Limited. However, this doesn’t necessarily mean the pay is too high. We can get a better idea of how generous the pay is by looking at the performance of the underlying business.
The graphic below shows how CEO compensation at 3P Learning has changed from year to year.
Is 3P Learning Limited Growing?
On average over the last three years, 3P Learning Limited has shrunk earnings per share by 85% each year. In the last year, its revenue is up 5.6%.
Few shareholders would be pleased to read that earnings per share are lower over three years. The fairly low revenue growth fails to impress given that the earnings per share is down. So given this relatively weak performance, shareholders would probably not want to see high compensation for the CEO.
Shareholders might be interested in this free visualization of analyst forecasts. .
Has 3P Learning Limited Been A Good Investment?
With a three year total loss of 22%, 3P Learning Limited would certainly have some dissatisfied shareholders. It therefore might be upsetting for shareholders if the CEO were paid generously.
In Summary…
We compared total CEO remuneration at 3P Learning Limited with the amount paid at companies with a similar market capitalization. Our data suggests that it pays above the median CEO pay within that group.
Neither earnings per share nor revenue have been growing sufficiently fast to impress us, over the last three years.
Over the same period, investors would have come away with nothing in the way of share price gains. This analysis suggests to us that the CEO is paid too generously! So you may want to check if insiders are buying 3P Learning shares with their own money (free access).
Or you might rather take a peek at this analytical visualization of historic cash flow, earnings and revenue.
To help readers see past the short term volatility of the financial market, we aim to bring you a long-term focused research analysis purely driven by fundamental data. Note that our analysis does not factor in the latest price-sensitive company announcements.
The author is an independent contributor and at the time of publication had no position in the stocks mentioned. For errors that warrant correction please contact the editor at editorial-team@simplywallst.com.
