
 Yahoo Finance
 Why TORC Oil & Gas Ltd.'s (TSE:TOG) High P/E Ratio Isn't Necessarily A Bad Thing

The goal of this article is to teach you how to use price to earnings ratios (P/E ratios). We'll look at TORC Oil & Gas Ltd.'s (TSE:TOG) P/E ratio and reflect on what it tells us about the company's share price. Looking at earnings over the last twelve months, TORC Oil & Gas has a P/E ratio of 44.99. That corresponds to an earnings yield of approximately 2.2%.
View our latest analysis for TORC Oil & Gas
How Do You Calculate A P/E Ratio?
The formula for price to earnings is:
Price to Earnings Ratio = Price per Share ÷ Earnings per Share (EPS)
Or for TORC Oil & Gas:
P/E of 44.99 = CA$3.36 ÷ CA$0.075 (Based on the trailing twelve months to June 2019.)
Is A High Price-to-Earnings Ratio Good?
A higher P/E ratio implies that investors pay a higher price for the earning power of the business. All else being equal, it's better to pay a low price -- but as Warren Buffett said, 'It's far better to buy a wonderful company at a fair price than a fair company at a wonderful price.'
Does TORC Oil & Gas Have A Relatively High Or Low P/E For Its Industry?
The P/E ratio essentially measures market expectations of a company. The image below shows that TORC Oil & Gas has a significantly higher P/E than the average (8) P/E for companies in the oil and gas industry.
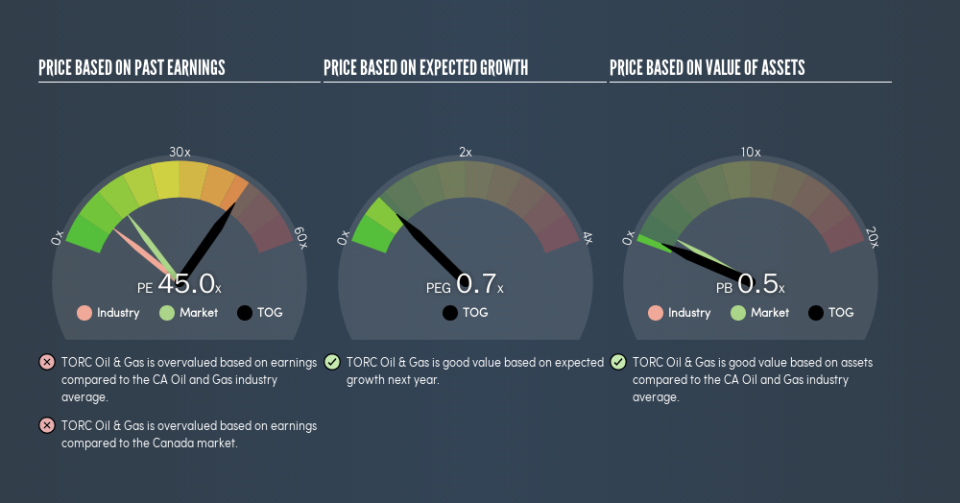
That means that the market expects TORC Oil & Gas will outperform other companies in its industry. Clearly the market expects growth, but it isn't guaranteed. So investors should always consider the P/E ratio alongside other factors, such as whether company directors have been buying shares.
How Growth Rates Impact P/E Ratios
Probably the most important factor in determining what P/E a company trades on is the earnings growth. If earnings are growing quickly, then the 'E' in the equation will increase faster than it would otherwise. That means even if the current P/E is high, it will reduce over time if the share price stays flat. And as that P/E ratio drops, the company will look cheap, unless its share price increases.
In the last year, TORC Oil & Gas grew EPS like Taylor Swift grew her fan base back in 2010; the 419% gain was both fast and well deserved. Regrettably, the longer term performance is poor, with EPS down 2.7% per year over 5 years.
Don't Forget: The P/E Does Not Account For Debt or Bank Deposits
The 'Price' in P/E reflects the market capitalization of the company. That means it doesn't take debt or cash into account. Hypothetically, a company could reduce its future P/E ratio by spending its cash (or taking on debt) to achieve higher earnings.
While growth expenditure doesn't always pay off, the point is that it is a good option to have; but one that the P/E ratio ignores.
How Does TORC Oil & Gas's Debt Impact Its P/E Ratio?
TORC Oil & Gas has net debt equal to 40% of its market cap. While it's worth keeping this in mind, it isn't a worry.
The Bottom Line On TORC Oil & Gas's P/E Ratio
TORC Oil & Gas's P/E is 45 which is way above average (14) in its market. While the company does use modest debt, its recent earnings growth is superb. So on this analysis a high P/E ratio seems reasonable.
When the market is wrong about a stock, it gives savvy investors an opportunity. As value investor Benjamin Graham famously said, 'In the short run, the market is a voting machine but in the long run, it is a weighing machine.' So this free visualization of the analyst consensus on future earnings could help you make the right decision about whether to buy, sell, or hold.
But note: TORC Oil & Gas may not be the best stock to buy. So take a peek at this free list of interesting companies with strong recent earnings growth (and a P/E ratio below 20).
We aim to bring you long-term focused research analysis driven by fundamental data. Note that our analysis may not factor in the latest price-sensitive company announcements or qualitative material.
If you spot an error that warrants correction, please contact the editor at editorial-team@simplywallst.com. This article by Simply Wall St is general in nature. It does not constitute a recommendation to buy or sell any stock, and does not take account of your objectives, or your financial situation. Simply Wall St has no position in the stocks mentioned. Thank you for reading.
