
 Yahoo Finance
 Why We Like SEMAFO Inc.’s (TSE:SMF) 12% Return On Capital Employed

Today we'll look at SEMAFO Inc. (TSE:SMF) and reflect on its potential as an investment. Specifically, we'll consider its Return On Capital Employed (ROCE), since that will give us an insight into how efficiently the business can generate profits from the capital it requires.
Firstly, we'll go over how we calculate ROCE. Then we'll compare its ROCE to similar companies. And finally, we'll look at how its current liabilities are impacting its ROCE.
What is Return On Capital Employed (ROCE)?
ROCE is a measure of a company's yearly pre-tax profit (its return), relative to the capital employed in the business. In general, businesses with a higher ROCE are usually better quality. In brief, it is a useful tool, but it is not without drawbacks. Renowned investment researcher Michael Mauboussin has suggested that a high ROCE can indicate that 'one dollar invested in the company generates value of more than one dollar'.
So, How Do We Calculate ROCE?
The formula for calculating the return on capital employed is:
Return on Capital Employed = Earnings Before Interest and Tax (EBIT) ÷ (Total Assets - Current Liabilities)
Or for SEMAFO:
0.12 = US$120m ÷ (US$1.1b - US$143m) (Based on the trailing twelve months to September 2019.)
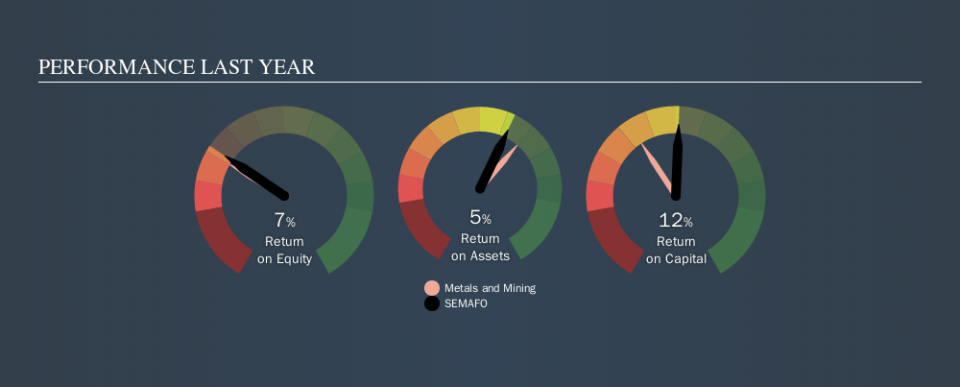
Therefore, SEMAFO has an ROCE of 12%.
See our latest analysis for SEMAFO
Does SEMAFO Have A Good ROCE?
ROCE can be useful when making comparisons, such as between similar companies. In our analysis, SEMAFO's ROCE is meaningfully higher than the 3.0% average in the Metals and Mining industry. I think that's good to see, since it implies the company is better than other companies at making the most of its capital. Independently of how SEMAFO compares to its industry, its ROCE in absolute terms appears decent, and the company may be worthy of closer investigation.
In our analysis, SEMAFO's ROCE appears to be 12%, compared to 3 years ago, when its ROCE was 8.0%. This makes us think about whether the company has been reinvesting shrewdly. The image below shows how SEMAFO's ROCE compares to its industry, and you can click it to see more detail on its past growth.
It is important to remember that ROCE shows past performance, and is not necessarily predictive. Companies in cyclical industries can be difficult to understand using ROCE, as returns typically look high during boom times, and low during busts. ROCE is, after all, simply a snap shot of a single year. Given the industry it operates in, SEMAFO could be considered cyclical. Future performance is what matters, and you can see analyst predictions in our free report on analyst forecasts for the company.
SEMAFO's Current Liabilities And Their Impact On Its ROCE
Current liabilities include invoices, such as supplier payments, short-term debt, or a tax bill, that need to be paid within 12 months. Due to the way the ROCE equation works, having large bills due in the near term can make it look as though a company has less capital employed, and thus a higher ROCE than usual. To counteract this, we check if a company has high current liabilities, relative to its total assets.
SEMAFO has total liabilities of US$143m and total assets of US$1.1b. Therefore its current liabilities are equivalent to approximately 13% of its total assets. Low current liabilities are not boosting the ROCE too much.
The Bottom Line On SEMAFO's ROCE
Overall, SEMAFO has a decent ROCE and could be worthy of further research. SEMAFO shapes up well under this analysis, but it is far from the only business delivering excellent numbers . You might also want to check this free collection of companies delivering excellent earnings growth.
I will like SEMAFO better if I see some big insider buys. While we wait, check out this free list of growing companies with considerable, recent, insider buying.
We aim to bring you long-term focused research analysis driven by fundamental data. Note that our analysis may not factor in the latest price-sensitive company announcements or qualitative material.
If you spot an error that warrants correction, please contact the editor at editorial-team@simplywallst.com. This article by Simply Wall St is general in nature. It does not constitute a recommendation to buy or sell any stock, and does not take account of your objectives, or your financial situation. Simply Wall St has no position in the stocks mentioned. Thank you for reading.
