
 Yahoo Finance
 Why We Like The Returns At TriNet Group (NYSE:TNET)
If you're looking for a multi-bagger, there's a few things to keep an eye out for. Ideally, a business will show two trends; firstly a growing return on capital employed (ROCE) and secondly, an increasing amount of capital employed. Put simply, these types of businesses are compounding machines, meaning they are continually reinvesting their earnings at ever-higher rates of return. So when we looked at the ROCE trend of TriNet Group (NYSE:TNET) we really liked what we saw.
Understanding Return On Capital Employed (ROCE)
For those that aren't sure what ROCE is, it measures the amount of pre-tax profits a company can generate from the capital employed in its business. The formula for this calculation on TriNet Group is:
Return on Capital Employed = Earnings Before Interest and Tax (EBIT) ÷ (Total Assets - Current Liabilities)
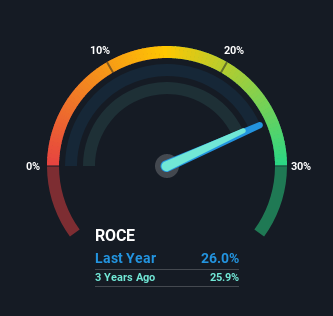
0.26 = US$394m ÷ (US$3.1b - US$1.6b) (Based on the trailing twelve months to September 2021).
Therefore, TriNet Group has an ROCE of 26%. That's a fantastic return and not only that, it outpaces the average of 11% earned by companies in a similar industry.
Check out our latest analysis for TriNet Group
Above you can see how the current ROCE for TriNet Group compares to its prior returns on capital, but there's only so much you can tell from the past. If you'd like to see what analysts are forecasting going forward, you should check out our free report for TriNet Group.
What Can We Tell From TriNet Group's ROCE Trend?
TriNet Group is displaying some positive trends. Over the last five years, returns on capital employed have risen substantially to 26%. The company is effectively making more money per dollar of capital used, and it's worth noting that the amount of capital has increased too, by 128%. So we're very much inspired by what we're seeing at TriNet Group thanks to its ability to profitably reinvest capital.
On a separate but related note, it's important to know that TriNet Group has a current liabilities to total assets ratio of 51%, which we'd consider pretty high. This effectively means that suppliers (or short-term creditors) are funding a large portion of the business, so just be aware that this can introduce some elements of risk. Ideally we'd like to see this reduce as that would mean fewer obligations bearing risks.
What We Can Learn From TriNet Group's ROCE
To sum it up, TriNet Group has proven it can reinvest in the business and generate higher returns on that capital employed, which is terrific. And a remarkable 281% total return over the last five years tells us that investors are expecting more good things to come in the future. So given the stock has proven it has promising trends, it's worth researching the company further to see if these trends are likely to persist.
If you want to continue researching TriNet Group, you might be interested to know about the 1 warning sign that our analysis has discovered.
High returns are a key ingredient to strong performance, so check out our free list ofstocks earning high returns on equity with solid balance sheets.
Have feedback on this article? Concerned about the content? Get in touch with us directly. Alternatively, email editorial-team (at) simplywallst.com.
This article by Simply Wall St is general in nature. We provide commentary based on historical data and analyst forecasts only using an unbiased methodology and our articles are not intended to be financial advice. It does not constitute a recommendation to buy or sell any stock, and does not take account of your objectives, or your financial situation. We aim to bring you long-term focused analysis driven by fundamental data. Note that our analysis may not factor in the latest price-sensitive company announcements or qualitative material. Simply Wall St has no position in any stocks mentioned.
