
 Yahoo Finance
 Why Public Service Enterprise Group Incorporated’s (NYSE:PEG) Return On Capital Employed Is Impressive

Today we'll evaluate Public Service Enterprise Group Incorporated (NYSE:PEG) to determine whether it could have potential as an investment idea. Specifically, we're going to calculate its Return On Capital Employed (ROCE), in the hopes of getting some insight into the business.
First, we'll go over how we calculate ROCE. Second, we'll look at its ROCE compared to similar companies. And finally, we'll look at how its current liabilities are impacting its ROCE.
What is Return On Capital Employed (ROCE)?
ROCE measures the 'return' (pre-tax profit) a company generates from capital employed in its business. Generally speaking a higher ROCE is better. In brief, it is a useful tool, but it is not without drawbacks. Renowned investment researcher Michael Mauboussin has suggested that a high ROCE can indicate that 'one dollar invested in the company generates value of more than one dollar'.
How Do You Calculate Return On Capital Employed?
The formula for calculating the return on capital employed is:
Return on Capital Employed = Earnings Before Interest and Tax (EBIT) ÷ (Total Assets - Current Liabilities)
Or for Public Service Enterprise Group:
0.059 = US$2.5b ÷ (US$46b - US$4.0b) (Based on the trailing twelve months to June 2019.)
So, Public Service Enterprise Group has an ROCE of 5.9%.
Check out our latest analysis for Public Service Enterprise Group
Is Public Service Enterprise Group's ROCE Good?
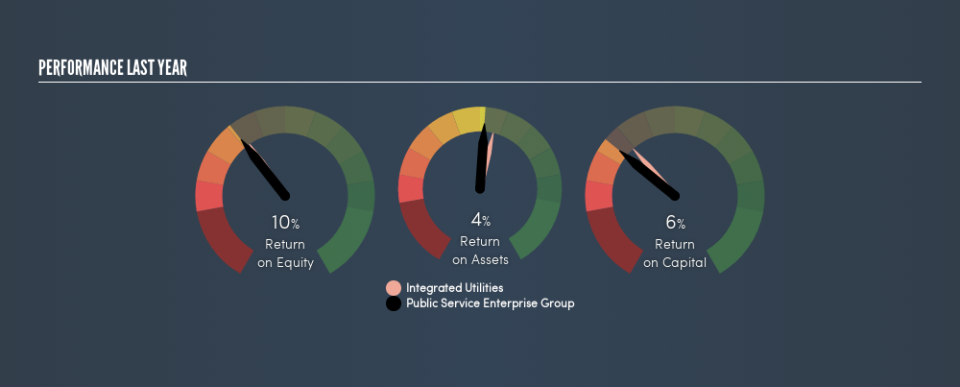
When making comparisons between similar businesses, investors may find ROCE useful. In our analysis, Public Service Enterprise Group's ROCE is meaningfully higher than the 4.9% average in the Integrated Utilities industry. I think that's good to see, since it implies the company is better than other companies at making the most of its capital. Separate from how Public Service Enterprise Group stacks up against its industry, its ROCE in absolute terms is mediocre; relative to the returns on government bonds. Readers may find more attractive investment prospects elsewhere.
You can see in the image below how Public Service Enterprise Group's ROCE compares to its industry. Click to see more on past growth.
It is important to remember that ROCE shows past performance, and is not necessarily predictive. ROCE can be misleading for companies in cyclical industries, with returns looking impressive during the boom times, but very weak during the busts. This is because ROCE only looks at one year, instead of considering returns across a whole cycle. What happens in the future is pretty important for investors, so we have prepared a free report on analyst forecasts for Public Service Enterprise Group.
How Public Service Enterprise Group's Current Liabilities Impact Its ROCE
Current liabilities include invoices, such as supplier payments, short-term debt, or a tax bill, that need to be paid within 12 months. Due to the way the ROCE equation works, having large bills due in the near term can make it look as though a company has less capital employed, and thus a higher ROCE than usual. To counteract this, we check if a company has high current liabilities, relative to its total assets.
Public Service Enterprise Group has total liabilities of US$4.0b and total assets of US$46b. Therefore its current liabilities are equivalent to approximately 8.6% of its total assets. With low levels of current liabilities, at least Public Service Enterprise Group's mediocre ROCE is not unduly boosted.
Our Take On Public Service Enterprise Group's ROCE
Based on this information, Public Service Enterprise Group appears to be a mediocre business. But note: make sure you look for a great company, not just the first idea you come across. So take a peek at this free list of interesting companies with strong recent earnings growth (and a P/E ratio below 20).
For those who like to find winning investments this free list of growing companies with recent insider purchasing, could be just the ticket.
We aim to bring you long-term focused research analysis driven by fundamental data. Note that our analysis may not factor in the latest price-sensitive company announcements or qualitative material.
If you spot an error that warrants correction, please contact the editor at editorial-team@simplywallst.com. This article by Simply Wall St is general in nature. It does not constitute a recommendation to buy or sell any stock, and does not take account of your objectives, or your financial situation. Simply Wall St has no position in the stocks mentioned. Thank you for reading.
