
 Yahoo Finance
 Why Is Prologis (PLD) Down 7.1% Since its Last Earnings Report?

A month has gone by since the last earnings report for Prologis, Inc. PLD. Shares have lost about 7.1% in the past month, underperforming the market.
Will the recent negative trend continue leading up to its next earnings release, or is PLD due for a breakout? Before we dive into how investors and analysts have reacted as of late, let's take a quick look at its most recent earnings report in order to get a better handle on the important catalysts.
Prologis Q4 Revenues Beat on High Occupancy, FFO Tops
Prologis reported fourth-quarter 2017 core FFO per share of 67 cents, beating the Zacks Consensus Estimate of 66 cents. Results also compared favorably with the year-ago figure of 63 cents. The company experienced solid operating results and higher net promote income.
Net effective rent change improved in the quarter, while period-end occupancy remained at a record high.
The company generated rental and other revenues of $551.8 million, comfortably beating the Zacks Consensus Estimate of $534.3 million. Total revenues for the quarter amounted to $619.9 million and remained nearly unchanged year over year.
For full-year 2017, core FFO per share came in at $2.81, well ahead of the prior-year tally of $2.57. This was backed by 3.4% year-over-year growth in total revenues to $2.6 billion.
Quarter in Detail
At the end of the reported quarter, occupancy level in the company’s owned and managed portfolio was 97.2%, expanding 10 basis points (bps) year over year. The record occupancy level was driven by the U.S. portfolio which experienced 98.0% of occupancy.
During the quarter under review, Prologis signed 42 million square feet of leases in its owned and managed portfolio compared with 39 million square feet recorded in the year-ago period.
Prologis’ share of net effective rent change was 19.0% in the reported quarter compared with 16.0% recorded a year ago. The figure was led by the U.S. portfolio, which recorded impressive growth of 29.8%. Cash rent change was 8.8%, as against 7.0% recorded in the year-earlier quarter.
Net effective same-store net operating income (NOI) registered 4.1% growth compared with 3.2% increase reported in the comparable period last year. This was led by 5.4% growth reported in the U.S. portfolio. Cash same-store NOI rose 5.5% compared with 4.4% reported in the year-ago period, reflecting 6.8% growth in the U.S. portfolio.
In fourth-quarter 2017, Prologis’ share of building acquisitions amounted to $79 million, development stabilization aggregated $525 million, while development starts totaled $692 million. Furthermore, the company’s total dispositions and contributions came in at $839 million.
Liquidity
Finally, the company exited the fourth quarter with cash and cash equivalents of $447.0 million compared with $568.7 million recorded at the end of the prior quarter.
Moreover, Prologis and its co-investment ventures accomplished $1.9 billion of refinancing as well as redeemed $788 million of near-term bonds during the quarter. In addition, for the full year, the company reported a 340-basis-point contraction in leverage to 23.7% on a market capitalization basis.
Outlook
Prologis offered its core FFO per share outlook for full-year 2018. The company projects core FFO per share in the range of $2.85-$2.95.
How Have Estimates Been Moving Since Then?
In the past month, investors have witnessed an upward trend in fresh estimates. There have been four revisions higher for the current quarter, while looking back an additional 30 days, we can see even more upward momentum.
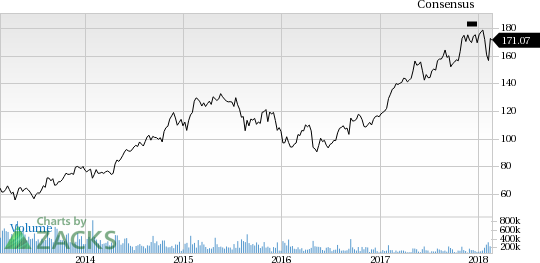
Prologis, Inc. Price and Consensus
Prologis, Inc. Price and Consensus | Prologis, Inc. Quote
VGM Scores
At this time, PLD has an average Growth Score of C, however its Momentum is doing a lot better with an A. However, the stock was also allocated a grade of F on the value side, putting it in the bottom 20% quintile for this investment strategy.
Overall, the stock has an aggregate VGM Score of D. If you aren't focused on one strategy, this score is the one you should be interested in.
Our style scores indicate that the stock is more suitable for momentum investors than growth investors.
Outlook
Estimates have been trending upward for the stock, and the magnitude of these revisions looks promising. Notably, PLD has a Zacks Rank #3 (Hold). We expect an in-line return from the stock in the next few months.
Want the latest recommendations from Zacks Investment Research? Today, you can download 7 Best Stocks for the Next 30 Days. Click to get this free report
Prologis, Inc. (PLD) : Free Stock Analysis Report
To read this article on Zacks.com click here.
Zacks Investment Research
