
 Yahoo Finance
 Why Pinnacle Renewable Energy Inc.’s (TSE:PL) Use Of Investor Capital Doesn’t Look Great

Today we'll look at Pinnacle Renewable Energy Inc. (TSE:PL) and reflect on its potential as an investment. Specifically, we're going to calculate its Return On Capital Employed (ROCE), in the hopes of getting some insight into the business.
First, we'll go over how we calculate ROCE. Then we'll compare its ROCE to similar companies. Then we'll determine how its current liabilities are affecting its ROCE.
What is Return On Capital Employed (ROCE)?
ROCE is a metric for evaluating how much pre-tax income (in percentage terms) a company earns on the capital invested in its business. All else being equal, a better business will have a higher ROCE. Ultimately, it is a useful but imperfect metric. Author Edwin Whiting says to be careful when comparing the ROCE of different businesses, since 'No two businesses are exactly alike.'
So, How Do We Calculate ROCE?
The formula for calculating the return on capital employed is:
Return on Capital Employed = Earnings Before Interest and Tax (EBIT) ÷ (Total Assets - Current Liabilities)
Or for Pinnacle Renewable Energy:
0.034 = CA$18m ÷ (CA$663m - CA$135m) (Based on the trailing twelve months to June 2019.)
So, Pinnacle Renewable Energy has an ROCE of 3.4%.
See our latest analysis for Pinnacle Renewable Energy
Does Pinnacle Renewable Energy Have A Good ROCE?
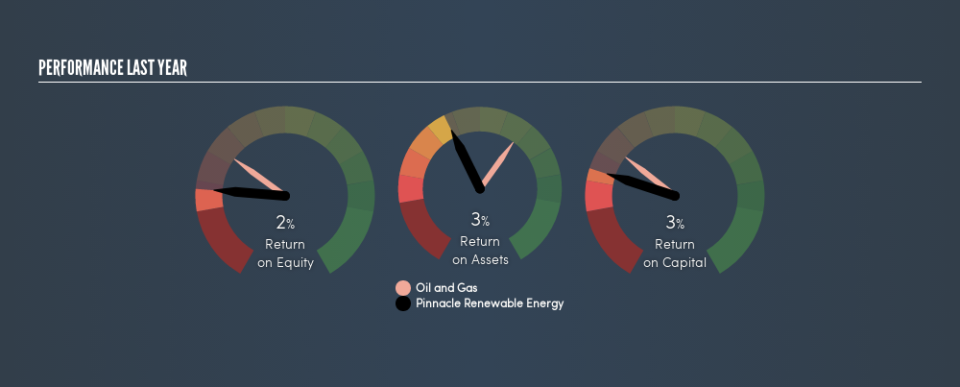
ROCE can be useful when making comparisons, such as between similar companies. In this analysis, Pinnacle Renewable Energy's ROCE appears meaningfully below the 5.8% average reported by the Oil and Gas industry. This performance is not ideal, as it suggests the company may not be deploying its capital as effectively as some competitors. Putting aside Pinnacle Renewable Energy's performance relative to its industry, its ROCE in absolute terms is poor - considering the risk of owning stocks compared to government bonds. There are potentially more appealing investments elsewhere.
Pinnacle Renewable Energy's current ROCE of 3.4% is lower than its ROCE in the past, which was 5.8%, 3 years ago. Therefore we wonder if the company is facing new headwinds. The image below shows how Pinnacle Renewable Energy's ROCE compares to its industry, and you can click it to see more detail on its past growth.
Remember that this metric is backwards looking - it shows what has happened in the past, and does not accurately predict the future. ROCE can be misleading for companies in cyclical industries, with returns looking impressive during the boom times, but very weak during the busts. This is because ROCE only looks at one year, instead of considering returns across a whole cycle. Remember that most companies like Pinnacle Renewable Energy are cyclical businesses. Future performance is what matters, and you can see analyst predictions in our free report on analyst forecasts for the company.
What Are Current Liabilities, And How Do They Affect Pinnacle Renewable Energy's ROCE?
Liabilities, such as supplier bills and bank overdrafts, are referred to as current liabilities if they need to be paid within 12 months. Due to the way ROCE is calculated, a high level of current liabilities makes a company look as though it has less capital employed, and thus can (sometimes unfairly) boost the ROCE. To counter this, investors can check if a company has high current liabilities relative to total assets.
Pinnacle Renewable Energy has total liabilities of CA$135m and total assets of CA$663m. Therefore its current liabilities are equivalent to approximately 20% of its total assets. With a very reasonable level of current liabilities, so the impact on ROCE is fairly minimal.
What We Can Learn From Pinnacle Renewable Energy's ROCE
While that is good to see, Pinnacle Renewable Energy has a low ROCE and does not look attractive in this analysis. But note: make sure you look for a great company, not just the first idea you come across. So take a peek at this free list of interesting companies with strong recent earnings growth (and a P/E ratio below 20).
If you like to buy stocks alongside management, then you might just love this free list of companies. (Hint: insiders have been buying them).
We aim to bring you long-term focused research analysis driven by fundamental data. Note that our analysis may not factor in the latest price-sensitive company announcements or qualitative material.
If you spot an error that warrants correction, please contact the editor at editorial-team@simplywallst.com. This article by Simply Wall St is general in nature. It does not constitute a recommendation to buy or sell any stock, and does not take account of your objectives, or your financial situation. Simply Wall St has no position in the stocks mentioned. Thank you for reading.
