
 Yahoo Finance
 Why Is Peabody Energy (BTU) Up 1.7% Since Its Last Earnings Report?

It has been about a month since the last earnings report for Peabody Energy Corporation BTU. Shares have added about 1.7% in that time frame.
Will the recent positive trend continue leading up to its next earnings release, or is BTU due for a pullback? Before we dive into how investors and analysts have reacted as of late, let's take a quick look at its most recent earnings report in order to get a better handle on the important drivers.
Peabody Posts Wider-than-Expected Q4 Loss, Gives Guidance
Coal producer Peabody Energy Corporation reported a loss of $9.27 per share in the fourth-quarter 2015, wider than the Zacks Consensus Estimate of a loss of $8.89, resulting in a negative surprise of 4.3%. However, Peabody was able to pare its loss to a large extent from a loss of $18.18 per share a year ago.
Revenues
Peabody’s quarterly revenues of $1.31 billion decreased 22.1% year over year but surpassed the Zacks Consensus Estimate by a meager 0.2%.
In 2015, Peabody recorded revenues of $6.79 billion, down 17.4% year over year. The top line was only 0.2% short of the Zacks Consensus Estimate. The decline in total revenues in 2015 was due to a drop in sales volume as well as a decline in the sales price per ton of coal.
Highlights of the Release
Peabody’s total sales volume in the quarter was 57.9 million tons, down 9.9% from the prior-year level. Sales volume in 2015 was 228.8 million tons, lagging last year’s sales of 249.8 million tons by 8.4%. Revenue per ton, in the U.S., in 2015 decreased 5.7% year over year to $19.84, while revenue per ton in Australia plunged 20.1% to $55.96.
Operating costs and expenses incurred in the reported quarter declined nearly 12% year over year to $1.23 billion.
Peabody’s 2015 earnings before interest, tax, depreciation and amortization (“EBITDA”) were $434.6 million, down 46.6% from $814 million in 2014.
Financial Update
As of Dec 31, 2015, Peabody had $261.3 million in cash and $221.3 million in inventories compared with $298.0 million in cash and $563.1 million in inventories as of Dec 31, 2014.
Long-term debt as of Dec 31, 2014, was $6.29 billion compared with $5.96 billion as of Dec 31, 2014.
Guidance
For 2016, the company is targeting total sales of 195–210 million tons, including 150–160 million tons from the U.S., 34–36 million tons from Australia and the remainder from Trading and Brokerage activities.The company projects 2016 capital spending of $120–$140 million.
How Have Estimates Been Moving Since Then?
In the past month, investors have witnessed a downward trend in fresh estimates. There has been one revision lower for the current quarter.
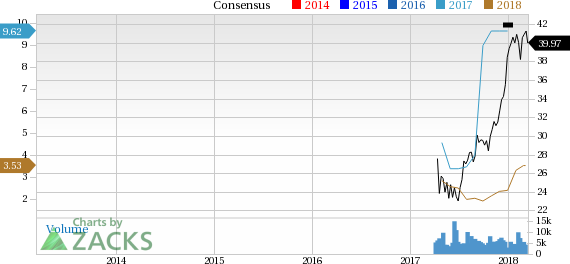
Peabody Energy Corporation Price and Consensus
Peabody Energy Corporation Price and Consensus | Peabody Energy Corporation Quote
VGM Scores
At this time, BTU has a subpar Growth Score of D. Its Momentum is doing a bit better with a C. The stock was allocated a grade of B on the value side, putting it in the top 40% for this investment strategy.
Overall, the stock has an aggregate VGM Score of C. If you aren't focused on one strategy, this score is the one you should be interested in.
Our style scores indicate that the stock is more suitable for value investors than momentum investors.
Outlook
Estimates have been broadly trending downward for the stock and the magnitude of this revision indicates a downward shift. Notably, BTU has a Zacks Rank #2 (Buy). We expect an above average return from the stock in the next few months.
Want the latest recommendations from Zacks Investment Research? Today, you can download 7 Best Stocks for the Next 30 Days. Click to get this free report
Peabody Energy Corporation (BTU) : Free Stock Analysis Report
To read this article on Zacks.com click here.
Zacks Investment Research
