
 Yahoo Finance
 Why Par Pacific Holdings, Inc.'s (NYSE:PARR) High P/E Ratio Isn't Necessarily A Bad Thing

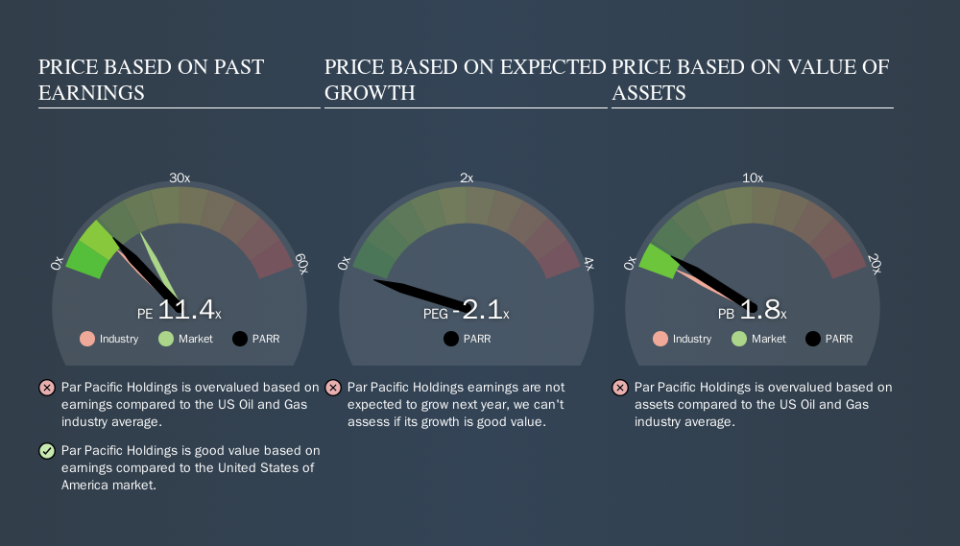
This article is for investors who would like to improve their understanding of price to earnings ratios (P/E ratios). We'll look at Par Pacific Holdings, Inc.'s (NYSE:PARR) P/E ratio and reflect on what it tells us about the company's share price. Par Pacific Holdings has a price to earnings ratio of 11.42, based on the last twelve months. That is equivalent to an earnings yield of about 8.8%.
Check out our latest analysis for Par Pacific Holdings
How Do You Calculate A P/E Ratio?
The formula for P/E is:
Price to Earnings Ratio = Share Price ÷ Earnings per Share (EPS)
Or for Par Pacific Holdings:
P/E of 11.42 = $23.05 ÷ $2.02 (Based on the trailing twelve months to June 2019.)
Is A High P/E Ratio Good?
A higher P/E ratio means that investors are paying a higher price for each $1 of company earnings. That is not a good or a bad thing per se, but a high P/E does imply buyers are optimistic about the future.
How Does Par Pacific Holdings's P/E Ratio Compare To Its Peers?
The P/E ratio essentially measures market expectations of a company. You can see in the image below that the average P/E (9.9) for companies in the oil and gas industry is lower than Par Pacific Holdings's P/E.
Its relatively high P/E ratio indicates that Par Pacific Holdings shareholders think it will perform better than other companies in its industry classification. Clearly the market expects growth, but it isn't guaranteed. So investors should always consider the P/E ratio alongside other factors, such as whether company directors have been buying shares.
How Growth Rates Impact P/E Ratios
Earnings growth rates have a big influence on P/E ratios. When earnings grow, the 'E' increases, over time. That means even if the current P/E is high, it will reduce over time if the share price stays flat. Then, a lower P/E should attract more buyers, pushing the share price up.
It's nice to see that Par Pacific Holdings grew EPS by a stonking 35% in the last year.
A Limitation: P/E Ratios Ignore Debt and Cash In The Bank
One drawback of using a P/E ratio is that it considers market capitalization, but not the balance sheet. Thus, the metric does not reflect cash or debt held by the company. The exact same company would hypothetically deserve a higher P/E ratio if it had a strong balance sheet, than if it had a weak one with lots of debt, because a cashed up company can spend on growth.
Such expenditure might be good or bad, in the long term, but the point here is that the balance sheet is not reflected by this ratio.
Par Pacific Holdings's Balance Sheet
Par Pacific Holdings's net debt equates to 46% of its market capitalization. You'd want to be aware of this fact, but it doesn't bother us.
The Verdict On Par Pacific Holdings's P/E Ratio
Par Pacific Holdings's P/E is 11.4 which is below average (18.2) in the US market. The EPS growth last year was strong, and debt levels are quite reasonable. If the company can continue to grow earnings, then the current P/E may be unjustifiably low. Given analysts are expecting further growth, one might have expected a higher P/E ratio. That may be worth further research.
Investors should be looking to buy stocks that the market is wrong about. If it is underestimating a company, investors can make money by buying and holding the shares until the market corrects itself. So this free report on the analyst consensus forecasts could help you make a master move on this stock.
Of course you might be able to find a better stock than Par Pacific Holdings. So you may wish to see this free collection of other companies that have grown earnings strongly.
We aim to bring you long-term focused research analysis driven by fundamental data. Note that our analysis may not factor in the latest price-sensitive company announcements or qualitative material.
If you spot an error that warrants correction, please contact the editor at editorial-team@simplywallst.com. This article by Simply Wall St is general in nature. It does not constitute a recommendation to buy or sell any stock, and does not take account of your objectives, or your financial situation. Simply Wall St has no position in the stocks mentioned. Thank you for reading.
