
 Yahoo Finance
 Why We’re Not Impressed By Peyto Exploration & Development Corp.’s (TSE:PEY) 3.5% ROCE

Today we'll look at Peyto Exploration & Development Corp. (TSE:PEY) and reflect on its potential as an investment. Specifically, we'll consider its Return On Capital Employed (ROCE), since that will give us an insight into how efficiently the business can generate profits from the capital it requires.
First up, we'll look at what ROCE is and how we calculate it. Then we'll compare its ROCE to similar companies. Last but not least, we'll look at what impact its current liabilities have on its ROCE.
Understanding Return On Capital Employed (ROCE)
ROCE is a measure of a company's yearly pre-tax profit (its return), relative to the capital employed in the business. Generally speaking a higher ROCE is better. In brief, it is a useful tool, but it is not without drawbacks. Renowned investment researcher Michael Mauboussin has suggested that a high ROCE can indicate that 'one dollar invested in the company generates value of more than one dollar'.
How Do You Calculate Return On Capital Employed?
Analysts use this formula to calculate return on capital employed:
Return on Capital Employed = Earnings Before Interest and Tax (EBIT) ÷ (Total Assets - Current Liabilities)
Or for Peyto Exploration & Development:
0.035 = CA$123m ÷ (CA$3.6b - CA$113m) (Based on the trailing twelve months to December 2019.)
Therefore, Peyto Exploration & Development has an ROCE of 3.5%.
Check out our latest analysis for Peyto Exploration & Development
Is Peyto Exploration & Development's ROCE Good?
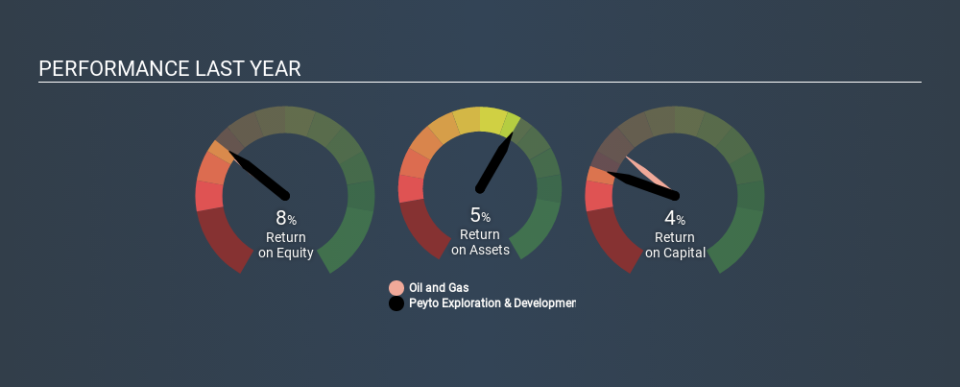
ROCE is commonly used for comparing the performance of similar businesses. We can see Peyto Exploration & Development's ROCE is meaningfully below the Oil and Gas industry average of 5.4%. This performance could be negative if sustained, as it suggests the business may underperform its industry. Independently of how Peyto Exploration & Development compares to its industry, its ROCE in absolute terms is low; especially compared to the ~1.4% available in government bonds. It is likely that there are more attractive prospects out there.
Peyto Exploration & Development's current ROCE of 3.5% is lower than 3 years ago, when the company reported a 5.9% ROCE. Therefore we wonder if the company is facing new headwinds. You can click on the image below to see (in greater detail) how Peyto Exploration & Development's past growth compares to other companies.
When considering this metric, keep in mind that it is backwards looking, and not necessarily predictive. Companies in cyclical industries can be difficult to understand using ROCE, as returns typically look high during boom times, and low during busts. ROCE is, after all, simply a snap shot of a single year. Given the industry it operates in, Peyto Exploration & Development could be considered cyclical. What happens in the future is pretty important for investors, so we have prepared a free report on analyst forecasts for Peyto Exploration & Development.
Do Peyto Exploration & Development's Current Liabilities Skew Its ROCE?
Current liabilities include invoices, such as supplier payments, short-term debt, or a tax bill, that need to be paid within 12 months. Due to the way ROCE is calculated, a high level of current liabilities makes a company look as though it has less capital employed, and thus can (sometimes unfairly) boost the ROCE. To counter this, investors can check if a company has high current liabilities relative to total assets.
Peyto Exploration & Development has total assets of CA$3.6b and current liabilities of CA$113m. Therefore its current liabilities are equivalent to approximately 3.2% of its total assets. Peyto Exploration & Development has a low level of current liabilities, which have a negligible impact on its already low ROCE.
The Bottom Line On Peyto Exploration & Development's ROCE
Nevertheless, there are potentially more attractive companies to invest in. You might be able to find a better investment than Peyto Exploration & Development. If you want a selection of possible winners, check out this free list of interesting companies that trade on a P/E below 20 (but have proven they can grow earnings).
Peyto Exploration & Development is not the only stock insiders are buying. So take a peek at this free list of growing companies with insider buying.
If you spot an error that warrants correction, please contact the editor at editorial-team@simplywallst.com. This article by Simply Wall St is general in nature. It does not constitute a recommendation to buy or sell any stock, and does not take account of your objectives, or your financial situation. Simply Wall St has no position in the stocks mentioned.
We aim to bring you long-term focused research analysis driven by fundamental data. Note that our analysis may not factor in the latest price-sensitive company announcements or qualitative material. Thank you for reading.
