
 Yahoo Finance
 Why Newpark Resources, Inc.’s (NYSE:NR) Return On Capital Employed Looks Uninspiring

Today we are going to look at Newpark Resources, Inc. (NYSE:NR) to see whether it might be an attractive investment prospect. Specifically, we'll consider its Return On Capital Employed (ROCE), since that will give us an insight into how efficiently the business can generate profits from the capital it requires.
Firstly, we'll go over how we calculate ROCE. Next, we'll compare it to others in its industry. Last but not least, we'll look at what impact its current liabilities have on its ROCE.
What is Return On Capital Employed (ROCE)?
ROCE is a metric for evaluating how much pre-tax income (in percentage terms) a company earns on the capital invested in its business. Generally speaking a higher ROCE is better. Overall, it is a valuable metric that has its flaws. Renowned investment researcher Michael Mauboussin has suggested that a high ROCE can indicate that 'one dollar invested in the company generates value of more than one dollar'.
So, How Do We Calculate ROCE?
Analysts use this formula to calculate return on capital employed:
Return on Capital Employed = Earnings Before Interest and Tax (EBIT) ÷ (Total Assets - Current Liabilities)
Or for Newpark Resources:
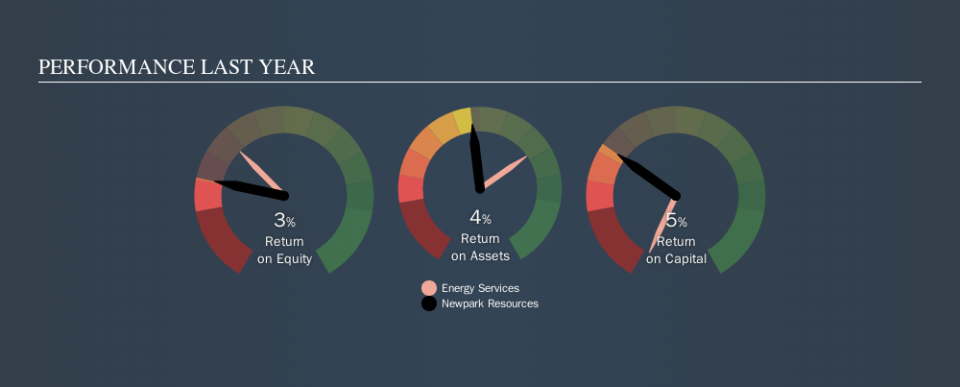
0.055 = US$43m ÷ (US$934m - US$144m) (Based on the trailing twelve months to June 2019.)
Therefore, Newpark Resources has an ROCE of 5.5%.
View our latest analysis for Newpark Resources
Is Newpark Resources's ROCE Good?
ROCE can be useful when making comparisons, such as between similar companies. In this analysis, Newpark Resources's ROCE appears meaningfully below the 9.6% average reported by the Energy Services industry. This performance is not ideal, as it suggests the company may not be deploying its capital as effectively as some competitors. Independently of how Newpark Resources compares to its industry, its ROCE in absolute terms is low; especially compared to the ~2.7% available in government bonds. There are potentially more appealing investments elsewhere.
Newpark Resources has an ROCE of 5.5%, but it didn't have an ROCE 3 years ago, since it was unprofitable. This makes us wonder if the company is improving. You can click on the image below to see (in greater detail) how Newpark Resources's past growth compares to other companies.
It is important to remember that ROCE shows past performance, and is not necessarily predictive. Companies in cyclical industries can be difficult to understand using ROCE, as returns typically look high during boom times, and low during busts. ROCE is only a point-in-time measure. Given the industry it operates in, Newpark Resources could be considered cyclical. What happens in the future is pretty important for investors, so we have prepared a free report on analyst forecasts for Newpark Resources.
How Newpark Resources's Current Liabilities Impact Its ROCE
Current liabilities are short term bills and invoices that need to be paid in 12 months or less. Due to the way the ROCE equation works, having large bills due in the near term can make it look as though a company has less capital employed, and thus a higher ROCE than usual. To counteract this, we check if a company has high current liabilities, relative to its total assets.
Newpark Resources has total liabilities of US$144m and total assets of US$934m. As a result, its current liabilities are equal to approximately 15% of its total assets. With a very reasonable level of current liabilities, so the impact on ROCE is fairly minimal.
What We Can Learn From Newpark Resources's ROCE
While that is good to see, Newpark Resources has a low ROCE and does not look attractive in this analysis. Of course, you might also be able to find a better stock than Newpark Resources. So you may wish to see this free collection of other companies that have grown earnings strongly.
I will like Newpark Resources better if I see some big insider buys. While we wait, check out this free list of growing companies with considerable, recent, insider buying.
We aim to bring you long-term focused research analysis driven by fundamental data. Note that our analysis may not factor in the latest price-sensitive company announcements or qualitative material.
If you spot an error that warrants correction, please contact the editor at editorial-team@simplywallst.com. This article by Simply Wall St is general in nature. It does not constitute a recommendation to buy or sell any stock, and does not take account of your objectives, or your financial situation. Simply Wall St has no position in the stocks mentioned. Thank you for reading.
