
 Yahoo Finance
 Why GoGold Resources Inc.'s (TSE:GGD) CEO Pay Matters To You

In 2016 Brad Langille was appointed CEO of GoGold Resources Inc. (TSE:GGD). First, this article will compare CEO compensation with compensation at similar sized companies. Then we'll look at a snap shot of the business growth. And finally we will reflect on how common stockholders have fared in the last few years, as a secondary measure of performance. This method should give us information to assess how appropriately the company pays the CEO.
Check out our latest analysis for GoGold Resources
How Does Brad Langille's Compensation Compare With Similar Sized Companies?
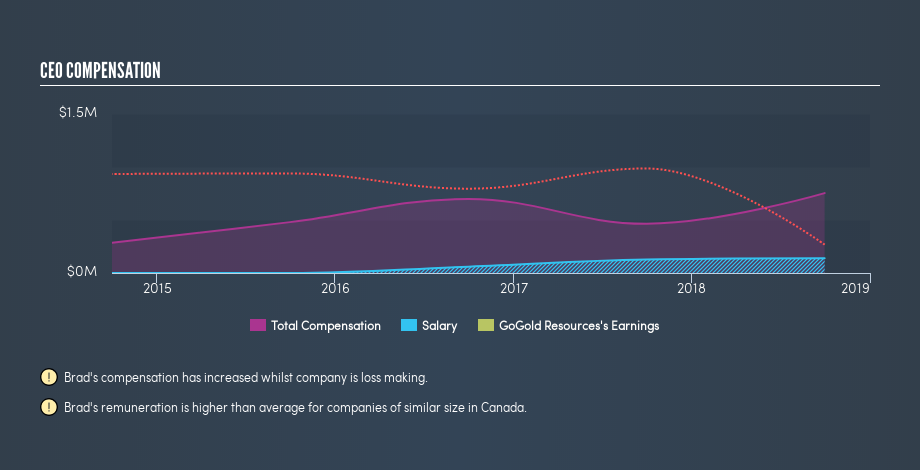
According to our data, GoGold Resources Inc. has a market capitalization of CA$96m, and pays its CEO total annual compensation worth US$753k. (This is based on the year to September 2018). While this analysis focuses on total compensation, it's worth noting the salary is lower, valued at US$138k. We looked at a group of companies with market capitalizations under CA$265m, and the median CEO total compensation was CA$144k.
As you can see, Brad Langille is paid more than the median CEO pay at companies of a similar size, in the same market. However, this does not necessarily mean GoGold Resources Inc. is paying too much. We can better assess whether the pay is overly generous by looking into the underlying business performance.
The graphic below shows how CEO compensation at GoGold Resources has changed from year to year.
Is GoGold Resources Inc. Growing?
On average over the last three years, GoGold Resources Inc. has shrunk earnings per share by 70% each year (measured with a line of best fit). It saw its revenue drop -5.5% over the last year.
Sadly for shareholders, earnings per share are actually down, over three years. This is compounded by the fact revenue is actually down on last year. So given this relatively weak performance, shareholders would probably not want to see high compensation for the CEO. It could be important to check this free visual depiction of what analysts expect for the future.
Has GoGold Resources Inc. Been A Good Investment?
Since shareholders would have lost about 48% over three years, some GoGold Resources Inc. shareholders would surely be feeling negative emotions. It therefore might be upsetting for shareholders if the CEO were paid generously.
In Summary...
We compared the total CEO remuneration paid by GoGold Resources Inc., and compared it to remuneration at a group of similar sized companies. Our data suggests that it pays above the median CEO pay within that group.
Earnings per share have not grown in three years, and the revenue growth fails to impress us.
Arguably worse, investors are without a positive return for the last three years. This analysis suggests to us that the CEO is paid too generously! So you may want to check if insiders are buying GoGold Resources shares with their own money (free access).
Important note: GoGold Resources may not be the best stock to buy. You might find something better in this list of interesting companies with high ROE and low debt.
We aim to bring you long-term focused research analysis driven by fundamental data. Note that our analysis may not factor in the latest price-sensitive company announcements or qualitative material.
If you spot an error that warrants correction, please contact the editor at editorial-team@simplywallst.com. This article by Simply Wall St is general in nature. It does not constitute a recommendation to buy or sell any stock, and does not take account of your objectives, or your financial situation. Simply Wall St has no position in the stocks mentioned. Thank you for reading.
