
 Yahoo Finance
 Why Every Dividend Investor Must Know the Free Cash Flow Payout Ratio
I don?t know about you, but as much as I like big yields, I prefer smaller, safer ones. The trick, of course, is finding a yield that is not only sizable, but also sustainable. While everyone has their own way of determining which yield is attractive for the foreseeable future, perhaps the best barometer of a yield?s quality is the free cash flow payout ratio.
The normal payout ratio?s shortfall
When it comes to payout ratios, most investors are familiar with the plain vanilla variant, which is derived by taking dividends per common share and dividing them by EPS, or earnings per share. Using this method, investors are quickly able to determine how big the company?s dividend is in regards to its bottom-line earnings.
Thankfully, most company websites already have this readily available, so we don?t have to do much calculating. However, as accessible as this ratio is, there is one major shortfall: the payout ratio, which uses net income in the denominator, takes into account non-cash charges such as depreciation and amortization. Therefore, it would be too conservative of a measure for capital-intensive companies such as energy producers or telecoms.
Enter the free cash flow payout
So how can we take into account non-cash charges such as depreciation and amortization and uncover a firm?s true dividend sustainability? The answer lies in the free cash flow (FCF) payout ratio. Calculating this ratio is simple enough: just take the company?s cash flows from operations and subtract capex.
The reason why the FCF ratio is superior to the plain vanilla payout ratio is because the FCF adds back all the non-cash charges into net income to arrive at cash flow operating activities (CFO), which is essentially cash the firm makes in the normal course of business.
In other words, CFO is what is required by the firm to ?keep the lights on,? so to speak, and therefore, it goes without saying that if a firm?s dividend is so big that it?s bigger than the amount of cash it?s generating on a daily basis to keep it running, then this dividend is probably not very sustainable.
Let?s take a look at the payout ratios in action via two energy names: Vermilion Energy Inc. (TSX:VET)(NYSE:VET) and Gibson Energy Inc. (TSX:GEI). As it is common in the energy space, both companies reported net losses of $156 million and $147 million, respectively, year to date in 2016. Therefore, right off the bat, the payout ratio is effectively useless.
Instead, by using the FCF payout ratio, we see that Vermilion paid out 47% of its FCF, while Gibson?s FCF was also negative. Thus, if I had to choose, I would pick Vermilion?s 4.6% yield over Gibson?s 6.8%, seeing as Gibson doesn?t have enough cash on hand after taking into account its capital expenditures.
One more example: take a look at the payouts of Rogers Communications Inc. (TSX:RCI.B)(NYSE:RCI) and Telus Corporation (TSX:T)(NYSE:TU). Based on their payout ratios (Q3 2016, year to date), it would appear that Rogers?s smaller yield of 3.8% is more constrained versus Telus?s larger 4.4% yield.
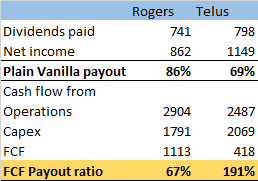
A comparison of the ?plain vanilla payout ratio? and the FCF payout ratio. (Source: author generated)
However, the FCF ratio tells a different story.
Ddue to Rogers?s higher non-cash charges and Telus?s elevated capex from its expansion into PureFibre, it is actually the latter company with the more constrained payout. Therefore, based on the FCF payouts, I would estimate that Rogers, as it currently stands, has less pressure on its dividend than Telus.
Looking for a few great dividend-paying stocks to buy today?
If so, you're in luck! Because we just tapped one of our top analysts -- and experts in this field -- and asked him to put together a special report highlighting three of his favorite dividend-payers to buy right now.
These three "Cash Kings" have an average yield of 4.0%... are poised to profit from three diverse (and highly crucial) sectors of the economy... and look like they have the ability to grow their dividend well into the future.
For a limited time you can get a copy of this brand new special report free of charge by simply clicking here.
More reading
Fool contributor Alexander John Tun has no position in any stocks mentioned.
Looking for a few great dividend-paying stocks to buy today?
If so, you're in luck! Because we just tapped one of our top analysts -- and experts in this field -- and asked him to put together a special report highlighting three of his favorite dividend-payers to buy right now.
These three "Cash Kings" have an average yield of 4.0%... are poised to profit from three diverse (and highly crucial) sectors of the economy... and look like they have the ability to grow their dividend well into the future.
For a limited time you can get a copy of this brand new special report free of charge by simply clicking here.
Fool contributor Alexander John Tun has no position in any stocks mentioned.
