
 Yahoo Finance
 Why We Like Equinor ASA’s (OB:EQNR) 17% Return On Capital Employed

Today we'll evaluate Equinor ASA (OB:EQNR) to determine whether it could have potential as an investment idea. Specifically, we'll consider its Return On Capital Employed (ROCE), since that will give us an insight into how efficiently the business can generate profits from the capital it requires.
First up, we'll look at what ROCE is and how we calculate it. Next, we'll compare it to others in its industry. Last but not least, we'll look at what impact its current liabilities have on its ROCE.
Return On Capital Employed (ROCE): What is it?
ROCE measures the amount of pre-tax profits a company can generate from the capital employed in its business. Generally speaking a higher ROCE is better. In brief, it is a useful tool, but it is not without drawbacks. Renowned investment researcher Michael Mauboussin has suggested that a high ROCE can indicate that 'one dollar invested in the company generates value of more than one dollar'.
So, How Do We Calculate ROCE?
Analysts use this formula to calculate return on capital employed:
Return on Capital Employed = Earnings Before Interest and Tax (EBIT) ÷ (Total Assets - Current Liabilities)
Or for Equinor:
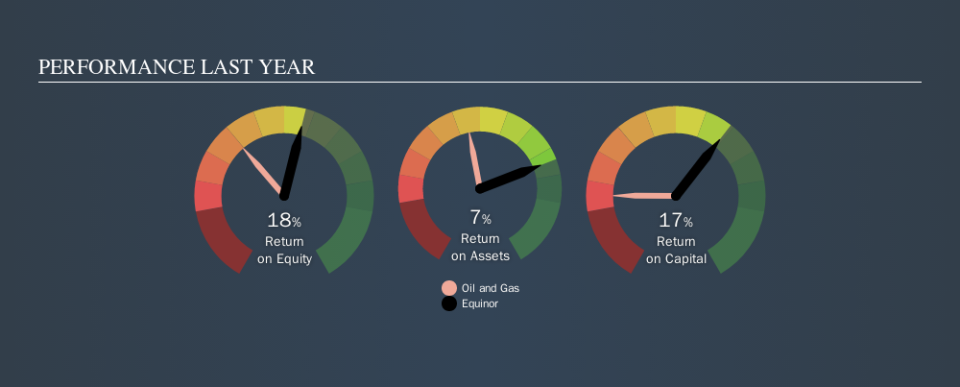
0.17 = US$17b ÷ (US$124b - US$20b) (Based on the trailing twelve months to June 2019.)
Therefore, Equinor has an ROCE of 17%.
View our latest analysis for Equinor
Is Equinor's ROCE Good?
When making comparisons between similar businesses, investors may find ROCE useful. Using our data, we find that Equinor's ROCE is meaningfully better than the 13% average in the Oil and Gas industry. I think that's good to see, since it implies the company is better than other companies at making the most of its capital. Separate from Equinor's performance relative to its industry, its ROCE in absolute terms looks satisfactory, and it may be worth researching in more depth.
Our data shows that Equinor currently has an ROCE of 17%, compared to its ROCE of 1.2% 3 years ago. This makes us think the business might be improving. You can see in the image below how Equinor's ROCE compares to its industry. Click to see more on past growth.
When considering ROCE, bear in mind that it reflects the past and does not necessarily predict the future. Companies in cyclical industries can be difficult to understand using ROCE, as returns typically look high during boom times, and low during busts. ROCE is only a point-in-time measure. Given the industry it operates in, Equinor could be considered cyclical. Since the future is so important for investors, you should check out our free report on analyst forecasts for Equinor.
What Are Current Liabilities, And How Do They Affect Equinor's ROCE?
Current liabilities include invoices, such as supplier payments, short-term debt, or a tax bill, that need to be paid within 12 months. Due to the way ROCE is calculated, a high level of current liabilities makes a company look as though it has less capital employed, and thus can (sometimes unfairly) boost the ROCE. To check the impact of this, we calculate if a company has high current liabilities relative to its total assets.
Equinor has total liabilities of US$20b and total assets of US$124b. Therefore its current liabilities are equivalent to approximately 16% of its total assets. Current liabilities are minimal, limiting the impact on ROCE.
What We Can Learn From Equinor's ROCE
This is good to see, and with a sound ROCE, Equinor could be worth a closer look. Equinor looks strong on this analysis, but there are plenty of other companies that could be a good opportunity . Here is a free list of companies growing earnings rapidly.
If you are like me, then you will not want to miss this free list of growing companies that insiders are buying.
We aim to bring you long-term focused research analysis driven by fundamental data. Note that our analysis may not factor in the latest price-sensitive company announcements or qualitative material.
If you spot an error that warrants correction, please contact the editor at editorial-team@simplywallst.com. This article by Simply Wall St is general in nature. It does not constitute a recommendation to buy or sell any stock, and does not take account of your objectives, or your financial situation. Simply Wall St has no position in the stocks mentioned. Thank you for reading.
