
 Yahoo Finance
 Why EMX Royalty Corporation’s (CVE:EMX) CEO Pay Matters To You

Want to participate in a short research study? Help shape the future of investing tools and receive a $20 prize!
Dave Cole has been the CEO of EMX Royalty Corporation (CVE:EMX) since 2003. This analysis aims first to contrast CEO compensation with other companies that have similar market capitalization. Then we’ll look at a snap shot of the business growth. And finally – as a second measure of performance – we will look at the returns shareholders have received over the last few years. The aim of all this is to consider the appropriateness of CEO pay levels.
See our latest analysis for EMX Royalty
How Does Dave Cole’s Compensation Compare With Similar Sized Companies?
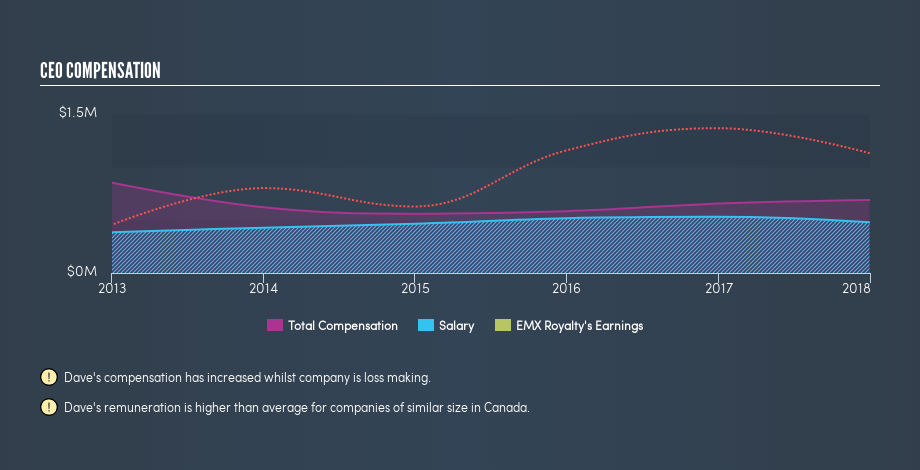
Our data indicates that EMX Royalty Corporation is worth CA$136m, and total annual CEO compensation is CA$689k. (This is based on the year to December 2017). While we always look at total compensation first, we note that the salary component is less, at CA$479k. We examined a group of similar sized companies, with market capitalizations of below CA$264m. The median CEO compensation in that group is CA$158k.
As you can see, Dave Cole is paid more than the median CEO pay at companies of a similar size, in the same market. However, this does not necessarily mean EMX Royalty Corporation is paying too much. A closer look at the performance of the underlying business will give us a better idea about whether the pay is particularly generous.
The graphic below shows how CEO compensation at EMX Royalty has changed from year to year.
Is EMX Royalty Corporation Growing?
On average over the last three years, EMX Royalty Corporation has grown earnings per share (EPS) by 7.1% each year (using a line of best fit). In the last year, its revenue is down -13%.
I would argue that the lack of revenue growth in the last year is less than ideal, but the improvement in EPS is good. In conclusion we can’t form a strong opinion about business performance yet; but it’s one worth watching. Although we don’t have analyst forecasts, you might want to assess this data-rich visualization of earnings, revenue and cash flow.
Has EMX Royalty Corporation Been A Good Investment?
I think that the total shareholder return of 147%, over three years, would leave most EMX Royalty Corporation shareholders smiling. This strong performance might mean some shareholders don’t mind if the CEO were to be paid more than is normal for a company of its size.
In Summary…
We examined the amount EMX Royalty Corporation pays its CEO, and compared it to the amount paid by similar sized companies. Our data suggests that it pays above the median CEO pay within that group.
Over the last three years returns to investors have been great, though we might have liked stronger business growth. So, considering these tasty returns, the CEO compensation may be quite appropriate. Whatever your view on compensation, you might want to check if insiders are buying or selling EMX Royalty shares (free trial).
If you want to buy a stock that is better than EMX Royalty, this free list of high return, low debt companies is a great place to look.
We aim to bring you long-term focused research analysis driven by fundamental data. Note that our analysis may not factor in the latest price-sensitive company announcements or qualitative material.
If you spot an error that warrants correction, please contact the editor at editorial-team@simplywallst.com. This article by Simply Wall St is general in nature. It does not constitute a recommendation to buy or sell any stock, and does not take account of your objectives, or your financial situation. Simply Wall St has no position in the stocks mentioned. Thank you for reading.
