
 Yahoo Finance
 Here’s why Diversified Royalty Corp.’s (TSE:DIV) Returns On Capital Matters So Much

Want to participate in a short research study? Help shape the future of investing tools and you could win a $250 gift card!
Today we’ll evaluate Diversified Royalty Corp. (TSE:DIV) to determine whether it could have potential as an investment idea. Specifically, we’ll consider its Return On Capital Employed (ROCE), since that will give us an insight into how efficiently the business can generate profits from the capital it requires.
First up, we’ll look at what ROCE is and how we calculate it. Second, we’ll look at its ROCE compared to similar companies. Finally, we’ll look at how its current liabilities affect its ROCE.
Understanding Return On Capital Employed (ROCE)
ROCE measures the amount of pre-tax profits a company can generate from the capital employed in its business. In general, businesses with a higher ROCE are usually better quality. Ultimately, it is a useful but imperfect metric. Renowned investment researcher Michael Mauboussin has suggested that a high ROCE can indicate that ‘one dollar invested in the company generates value of more than one dollar’.
So, How Do We Calculate ROCE?
Analysts use this formula to calculate return on capital employed:
Return on Capital Employed = Earnings Before Interest and Tax (EBIT) ÷ (Total Assets – Current Liabilities)
Or for Diversified Royalty:
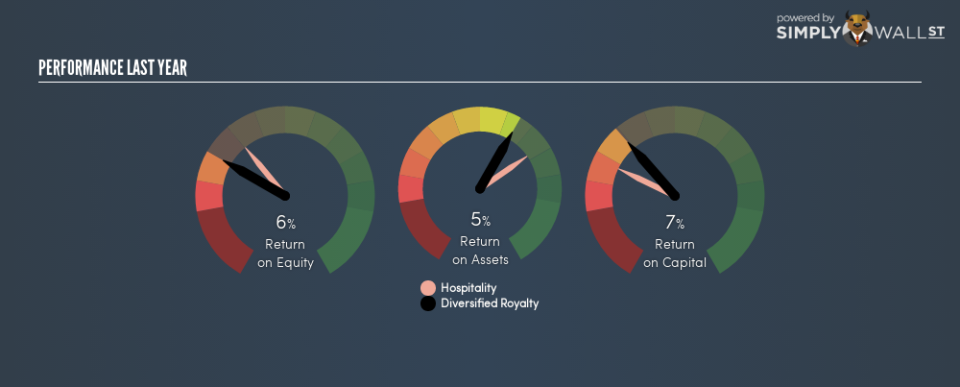
0.071 = CA$18m ÷ (CA$322m – CA$1.5m) (Based on the trailing twelve months to September 2018.)
So, Diversified Royalty has an ROCE of 7.1%.
Check out our latest analysis for Diversified Royalty
Is Diversified Royalty’s ROCE Good?
ROCE can be useful when making comparisons, such as between similar companies. Using our data, Diversified Royalty’s ROCE appears to be significantly below the 9.3% average in the Hospitality industry. This performance is not ideal, as it suggests the company may not be deploying its capital as effectively as some competitors. Separate from how Diversified Royalty stacks up against its industry, its ROCE in absolute terms is mediocre; relative to the returns on government bonds. It is possible that there are more rewarding investments out there.
As we can see, Diversified Royalty currently has an ROCE of 7.1% compared to its ROCE 3 years ago, which was 4.3%. This makes us think the business might be improving.
It is important to remember that ROCE shows past performance, and is not necessarily predictive. ROCE can be misleading for companies in cyclical industries, with returns looking impressive during the boom times, but very weak during the busts. ROCE is, after all, simply a snap shot of a single year. Future performance is what matters, and you can see analyst predictions in our free report on analyst forecasts for the company.
What Are Current Liabilities, And How Do They Affect Diversified Royalty’s ROCE?
Current liabilities include invoices, such as supplier payments, short-term debt, or a tax bill, that need to be paid within 12 months. Due to the way ROCE is calculated, a high level of current liabilities makes a company look as though it has less capital employed, and thus can (sometimes unfairly) boost the ROCE. To counteract this, we check if a company has high current liabilities, relative to its total assets.
Diversified Royalty has total assets of CA$322m and current liabilities of CA$1.5m. As a result, its current liabilities are equal to approximately 0.5% of its total assets. Diversified Royalty reports few current liabilities, which have a negligible impact on its unremarkable ROCE.
The Bottom Line On Diversified Royalty’s ROCE
Based on this information, Diversified Royalty appears to be a mediocre business. Of course you might be able to find a better stock than Diversified Royalty. So you may wish to see this free collection of other companies that have grown earnings strongly.
If you are like me, then you will not want to miss this free list of growing companies that insiders are buying.
To help readers see past the short term volatility of the financial market, we aim to bring you a long-term focused research analysis purely driven by fundamental data. Note that our analysis does not factor in the latest price-sensitive company announcements.
The author is an independent contributor and at the time of publication had no position in the stocks mentioned. For errors that warrant correction please contact the editor at editorial-team@simplywallst.com.
