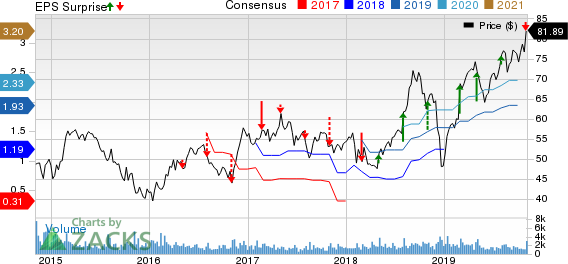
Why Clean Harbors (CLH) Stock is Down 3% Since Q3 Earnings
Shares of Clean Harbors, Inc. CLH have declined 2.6% since its third-quarter 2019 earnings release on Oct 30. The downward movement can be attributed to the company’s lower-than-expected bottom line performance and lowering of the high end of its net income guidance for 2019.
Notably, the company reported adjusted earnings per share of 72 cents, which lagged the consensus mark by 2 cents while improving 22% year over year. Net income for 2019 is now anticipated in the range of $85-$110 million compared with the previously guided range of $82-$115 million.
Clean Harbors, Inc. Price, Consensus and EPS Surprise

Clean Harbors, Inc. price-consensus-eps-surprise-chart | Clean Harbors, Inc. Quote
Total revenues of $891.7 million surpassed the consensus estimate by $21.4 million and increased 5.8% year over year.
Let’s check out the quarterly numbers in detail.
Revenues by Segment
Environmental Services revenues of $586.87 million increased 8% year over year on the back of growth in the company’s volumes (particularly Incineration, the mix of waste that the company receives) and strength across multiple service businesses, such as Field Services.
Safety-Kleen revenues of $306.15 million increased 2% year over year on growth in the core branch offerings and pricing initiatives, which partially offset slower-than-expected blended product sales in Safety-Kleen Oil.
Profitability Performance
Adjusted EBITDA of $156.61 million increased 10.9% year over year owing to the company’s strong business mix, pricing and higher efficiencies. Adjusted EBITDA margin increased 80 basis points (bps) year over year to 17.6%.
Segment-wise, Environmental Services’ adjusted EBITDA was $121.66 million, up 18.8% year over year and adjusted EBITDA margins improved 180 bps.
Safety-Kleen’s adjusted EBITDA of $81.32 million improved 2.3% year over year and adjusted EBITDA margins improved 20 bps.
Balance Sheet & Cash Flow
Clean Harbors exited third-quarter 2019 with cash and cash equivalents of $282.23 million compared with $204.46 million at the end of the prior quarter. Inventories and supplies were $210.83 million, up from $203.33 million in the prior quarter. Long-term debt of $1.56 billion was flat sequentially.
The company generated $146.21 million in cash from operating activities in the reported quarter. Adjusted free cash flow was $91.6 million.
During the reported quarter, the company repurchased 68,000 shares for an average price of $75.25 per share for a total of $5.1 million.
Guidance
Clean Harbors updated its 2019 guidance for adjusted EBITDA while reaffirming the same for adjusted free cash flow and net cash from operating activities.
The company now expects adjusted EBITDA of $530-550 million compared with the prior guided range of $520-$550 million. Segment wise, adjusted EBITDA for Environmental Services is anticipated to increase in low to mid-teens percentage. Safety-Kleen’s adjusted EBITDA is expected to grow in low single-digit range.
Adjusted free cash flow is expected between $200 million and 220 million. Net cash from operating activities is projected between $390 million and $430 million.
Zacks Rank & Upcoming Releases
Currently, Clean Harbors carries a Zacks Rank #3 (Hold). You can see the complete list of today’s Zacks #1 Rank (Strong Buy) stocks here.
Investors interested in the broader Zacks Business Services sector are awaiting third-quarter 2019 earnings of key players like Fiserv FISV, ICF International ICFI and FLEETCOR Technologies FLT, each scheduled to release results on Nov 6.
Biggest Tech Breakthrough in a Generation
Be among the early investors in the new type of device that experts say could impact society as much as the discovery of electricity. Current technology will soon be outdated and replaced by these new devices. In the process, it’s expected to create 22 million jobs and generate $12.3 trillion in activity.
A select few stocks could skyrocket the most as rollout accelerates for this new tech. Early investors could see gains similar to buying Microsoft in the 1990s. Zacks’ just-released special report reveals 8 stocks to watch. The report is only available for a limited time.
See 8 breakthrough stocks now>>
Want the latest recommendations from Zacks Investment Research? Today, you can download 7 Best Stocks for the Next 30 Days. Click to get this free report
FleetCor Technologies, Inc. (FLT) : Free Stock Analysis Report
Fiserv, Inc. (FISV) : Free Stock Analysis Report
ICF International, Inc. (ICFI) : Free Stock Analysis Report
Clean Harbors, Inc. (CLH) : Free Stock Analysis Report
To read this article on Zacks.com click here.
Zacks Investment Research

 Yahoo Finance