
 Yahoo Finance
 Why You Should Care About MSC Industrial Direct's (NYSE:MSM) Strong Returns On Capital
If we want to find a potential multi-bagger, often there are underlying trends that can provide clues. One common approach is to try and find a company with returns on capital employed (ROCE) that are increasing, in conjunction with a growing amount of capital employed. This shows us that it's a compounding machine, able to continually reinvest its earnings back into the business and generate higher returns. So, when we ran our eye over MSC Industrial Direct's (NYSE:MSM) trend of ROCE, we really liked what we saw.
Return On Capital Employed (ROCE): What Is It?
For those that aren't sure what ROCE is, it measures the amount of pre-tax profits a company can generate from the capital employed in its business. Analysts use this formula to calculate it for MSC Industrial Direct:
Return on Capital Employed = Earnings Before Interest and Tax (EBIT) ÷ (Total Assets - Current Liabilities)
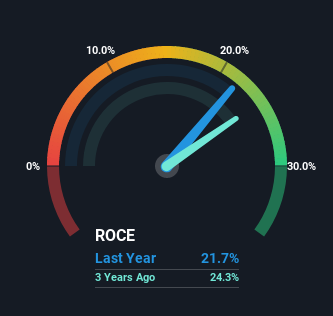
0.22 = US$433m ÷ (US$2.6b - US$620m) (Based on the trailing twelve months to May 2022).
Therefore, MSC Industrial Direct has an ROCE of 22%. In absolute terms that's a great return and it's even better than the Trade Distributors industry average of 14%.
See our latest analysis for MSC Industrial Direct
Above you can see how the current ROCE for MSC Industrial Direct compares to its prior returns on capital, but there's only so much you can tell from the past. If you'd like to see what analysts are forecasting going forward, you should check out our free report for MSC Industrial Direct.
What Can We Tell From MSC Industrial Direct's ROCE Trend?
MSC Industrial Direct deserves to be commended in regards to it's returns. The company has employed 31% more capital in the last five years, and the returns on that capital have remained stable at 22%. Returns like this are the envy of most businesses and given it has repeatedly reinvested at these rates, that's even better. If MSC Industrial Direct can keep this up, we'd be very optimistic about its future.
The Key Takeaway
In short, we'd argue MSC Industrial Direct has the makings of a multi-bagger since its been able to compound its capital at very profitable rates of return. Therefore it's no surprise that shareholders have earned a respectable 55% return if they held over the last five years. So even though the stock might be more "expensive" than it was before, we think the strong fundamentals warrant this stock for further research.
If you'd like to know about the risks facing MSC Industrial Direct, we've discovered 2 warning signs that you should be aware of.
If you'd like to see other companies earning high returns, check out our free list of companies earning high returns with solid balance sheets here.
Have feedback on this article? Concerned about the content? Get in touch with us directly. Alternatively, email editorial-team (at) simplywallst.com.
This article by Simply Wall St is general in nature. We provide commentary based on historical data and analyst forecasts only using an unbiased methodology and our articles are not intended to be financial advice. It does not constitute a recommendation to buy or sell any stock, and does not take account of your objectives, or your financial situation. We aim to bring you long-term focused analysis driven by fundamental data. Note that our analysis may not factor in the latest price-sensitive company announcements or qualitative material. Simply Wall St has no position in any stocks mentioned.
Join A Paid User Research Session
You’ll receive a US$30 Amazon Gift card for 1 hour of your time while helping us build better investing tools for the individual investors like yourself. Sign up here
