
 Yahoo Finance
 Why You Should Care About IMI's (LON:IMI) Strong Returns On Capital
Finding a business that has the potential to grow substantially is not easy, but it is possible if we look at a few key financial metrics. In a perfect world, we'd like to see a company investing more capital into its business and ideally the returns earned from that capital are also increasing. This shows us that it's a compounding machine, able to continually reinvest its earnings back into the business and generate higher returns. Ergo, when we looked at the ROCE trends at IMI (LON:IMI), we liked what we saw.
Understanding Return On Capital Employed (ROCE)
For those that aren't sure what ROCE is, it measures the amount of pre-tax profits a company can generate from the capital employed in its business. To calculate this metric for IMI, this is the formula:
Return on Capital Employed = Earnings Before Interest and Tax (EBIT) ÷ (Total Assets - Current Liabilities)
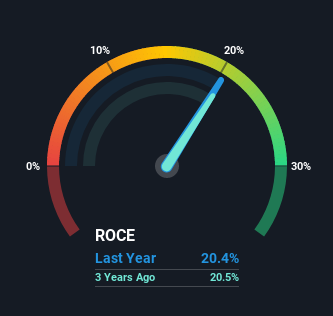
0.20 = UK£283m ÷ (UK£1.9b - UK£561m) (Based on the trailing twelve months to June 2021).
Thus, IMI has an ROCE of 20%. In absolute terms that's a great return and it's even better than the Machinery industry average of 10%.
See our latest analysis for IMI
Above you can see how the current ROCE for IMI compares to its prior returns on capital, but there's only so much you can tell from the past. If you'd like to see what analysts are forecasting going forward, you should check out our free report for IMI.
What Can We Tell From IMI's ROCE Trend?
It's hard not to be impressed by IMI's returns on capital. The company has employed 24% more capital in the last five years, and the returns on that capital have remained stable at 20%. Now considering ROCE is an attractive 20%, this combination is actually pretty appealing because it means the business can consistently put money to work and generate these high returns. If IMI can keep this up, we'd be very optimistic about its future.
The Key Takeaway
In summary, we're delighted to see that IMI has been compounding returns by reinvesting at consistently high rates of return, as these are common traits of a multi-bagger. On top of that, the stock has rewarded shareholders with a remarkable 111% return to those who've held over the last five years. So while the positive underlying trends may be accounted for by investors, we still think this stock is worth looking into further.
On the other side of ROCE, we have to consider valuation. That's why we have a FREE intrinsic value estimation on our platform that is definitely worth checking out.
High returns are a key ingredient to strong performance, so check out our free list ofstocks earning high returns on equity with solid balance sheets.
Have feedback on this article? Concerned about the content? Get in touch with us directly. Alternatively, email editorial-team (at) simplywallst.com.
This article by Simply Wall St is general in nature. We provide commentary based on historical data and analyst forecasts only using an unbiased methodology and our articles are not intended to be financial advice. It does not constitute a recommendation to buy or sell any stock, and does not take account of your objectives, or your financial situation. We aim to bring you long-term focused analysis driven by fundamental data. Note that our analysis may not factor in the latest price-sensitive company announcements or qualitative material. Simply Wall St has no position in any stocks mentioned.
