
 Yahoo Finance
 Why CanWel Building Materials Group Ltd.'s (TSE:CWX) High P/E Ratio Isn't Necessarily A Bad Thing

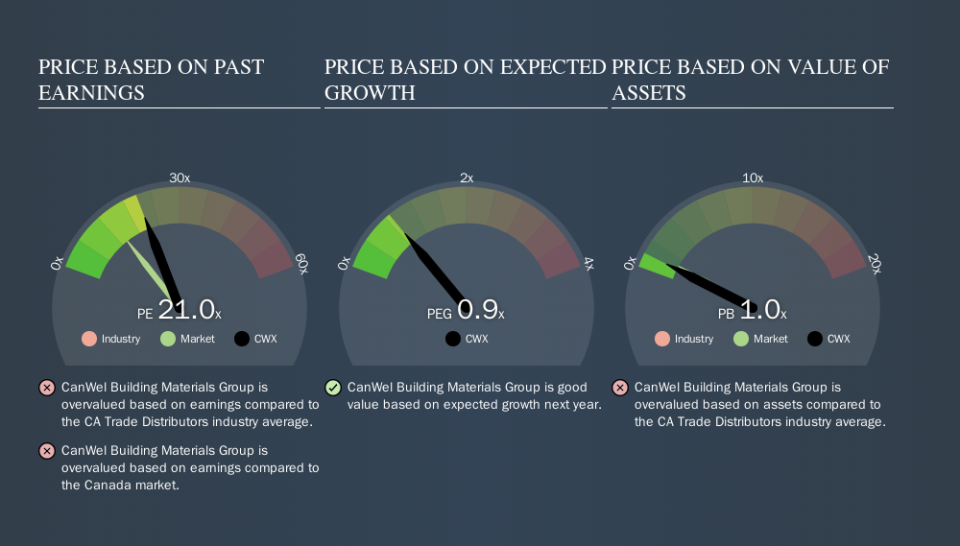
This article is written for those who want to get better at using price to earnings ratios (P/E ratios). To keep it practical, we'll show how CanWel Building Materials Group Ltd.'s (TSE:CWX) P/E ratio could help you assess the value on offer. CanWel Building Materials Group has a P/E ratio of 21.01, based on the last twelve months. In other words, at today's prices, investors are paying CA$21.01 for every CA$1 in prior year profit.
Check out our latest analysis for CanWel Building Materials Group
How Do You Calculate A P/E Ratio?
The formula for price to earnings is:
Price to Earnings Ratio = Share Price ÷ Earnings per Share (EPS)
Or for CanWel Building Materials Group:
P/E of 21.01 = CA$4.41 ÷ CA$0.21 (Based on the trailing twelve months to June 2019.)
Is A High P/E Ratio Good?
The higher the P/E ratio, the higher the price tag of a business, relative to its trailing earnings. That is not a good or a bad thing per se, but a high P/E does imply buyers are optimistic about the future.
Does CanWel Building Materials Group Have A Relatively High Or Low P/E For Its Industry?
The P/E ratio essentially measures market expectations of a company. As you can see below, CanWel Building Materials Group has a higher P/E than the average company (13.5) in the trade distributors industry.
CanWel Building Materials Group's P/E tells us that market participants think the company will perform better than its industry peers, going forward. Clearly the market expects growth, but it isn't guaranteed. So further research is always essential. I often monitor director buying and selling.
How Growth Rates Impact P/E Ratios
When earnings fall, the 'E' decreases, over time. That means unless the share price falls, the P/E will increase in a few years. Then, a higher P/E might scare off shareholders, pushing the share price down.
CanWel Building Materials Group's earnings per share fell by 59% in the last twelve months. And it has shrunk its earnings per share by 10.0% per year over the last five years. This might lead to muted expectations.
Don't Forget: The P/E Does Not Account For Debt or Bank Deposits
The 'Price' in P/E reflects the market capitalization of the company. That means it doesn't take debt or cash into account. Hypothetically, a company could reduce its future P/E ratio by spending its cash (or taking on debt) to achieve higher earnings.
While growth expenditure doesn't always pay off, the point is that it is a good option to have; but one that the P/E ratio ignores.
CanWel Building Materials Group's Balance Sheet
Net debt totals a substantial 121% of CanWel Building Materials Group's market cap. This level of debt justifies a relatively low P/E, so remain cognizant of the debt, if you're comparing it to other stocks.
The Verdict On CanWel Building Materials Group's P/E Ratio
CanWel Building Materials Group trades on a P/E ratio of 21.0, which is above its market average of 13.6. With significant debt and no EPS growth last year, shareholders are betting on an improvement in earnings from the company.
When the market is wrong about a stock, it gives savvy investors an opportunity. As value investor Benjamin Graham famously said, 'In the short run, the market is a voting machine but in the long run, it is a weighing machine. So this free visualization of the analyst consensus on future earnings could help you make the right decision about whether to buy, sell, or hold.
Of course you might be able to find a better stock than CanWel Building Materials Group. So you may wish to see this free collection of other companies that have grown earnings strongly.
We aim to bring you long-term focused research analysis driven by fundamental data. Note that our analysis may not factor in the latest price-sensitive company announcements or qualitative material.
If you spot an error that warrants correction, please contact the editor at editorial-team@simplywallst.com. This article by Simply Wall St is general in nature. It does not constitute a recommendation to buy or sell any stock, and does not take account of your objectives, or your financial situation. Simply Wall St has no position in the stocks mentioned. Thank you for reading.
