
 Yahoo Finance
 While insiders own 21% of Knight Therapeutics Inc. (TSE:GUD), retail investors are its largest shareholders with 56% ownership
Key Insights
Significant control over Knight Therapeutics by retail investors implies that the general public has more power to influence management and governance-related decisions
The top 25 shareholders own 43% of the company
To get a sense of who is truly in control of Knight Therapeutics Inc. (TSE:GUD), it is important to understand the ownership structure of the business. And the group that holds the biggest piece of the pie are retail investors with 56% ownership. In other words, the group stands to gain the most (or lose the most) from their investment into the company.
Individual insiders, on the other hand, account for 21% of the company's stockholders. Generally speaking, as a company grows, institutions will increase their ownership. Conversely, insiders often decrease their ownership over time.
Let's delve deeper into each type of owner of Knight Therapeutics, beginning with the chart below.
See our latest analysis for Knight Therapeutics

What Does The Institutional Ownership Tell Us About Knight Therapeutics?
Institutional investors commonly compare their own returns to the returns of a commonly followed index. So they generally do consider buying larger companies that are included in the relevant benchmark index.
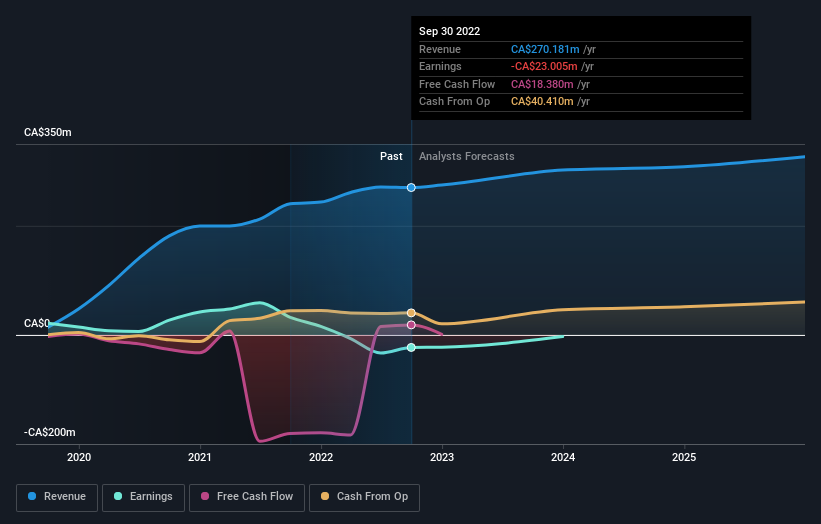
As you can see, institutional investors have a fair amount of stake in Knight Therapeutics. This implies the analysts working for those institutions have looked at the stock and they like it. But just like anyone else, they could be wrong. If multiple institutions change their view on a stock at the same time, you could see the share price drop fast. It's therefore worth looking at Knight Therapeutics' earnings history below. Of course, the future is what really matters.
Hedge funds don't have many shares in Knight Therapeutics. From our data, we infer that the largest shareholder is Jonathan Goodman (who also holds the title of Top Key Executive) with 20% of shares outstanding. Its usually considered a good sign when insiders own a significant number of shares in the company, and in this case, we're glad to see a company insider play the role of a key stakeholder. With 10% and 2.6% of the shares outstanding respectively, G2S2 Capital Inc. and Industrial Alliance Investment Management Inc. are the second and third largest shareholders.
On studying our ownership data, we found that 25 of the top shareholders collectively own less than 50% of the share register, implying that no single individual has a majority interest.
While it makes sense to study institutional ownership data for a company, it also makes sense to study analyst sentiments to know which way the wind is blowing. There are plenty of analysts covering the stock, so it might be worth seeing what they are forecasting, too.
Insider Ownership Of Knight Therapeutics
The definition of an insider can differ slightly between different countries, but members of the board of directors always count. The company management answer to the board and the latter should represent the interests of shareholders. Notably, sometimes top-level managers are on the board themselves.
Insider ownership is positive when it signals leadership are thinking like the true owners of the company. However, high insider ownership can also give immense power to a small group within the company. This can be negative in some circumstances.
It seems insiders own a significant proportion of Knight Therapeutics Inc.. Insiders own CA$115m worth of shares in the CA$551m company. It is great to see insiders so invested in the business. It might be worth checking if those insiders have been buying recently.
General Public Ownership
The general public, who are usually individual investors, hold a substantial 56% stake in Knight Therapeutics, suggesting it is a fairly popular stock. This size of ownership gives investors from the general public some collective power. They can and probably do influence decisions on executive compensation, dividend policies and proposed business acquisitions.
Private Company Ownership
Our data indicates that Private Companies hold 10%, of the company's shares. It's hard to draw any conclusions from this fact alone, so its worth looking into who owns those private companies. Sometimes insiders or other related parties have an interest in shares in a public company through a separate private company.
Next Steps:
I find it very interesting to look at who exactly owns a company. But to truly gain insight, we need to consider other information, too.
Many find it useful to take an in depth look at how a company has performed in the past. You can access this detailed graph of past earnings, revenue and cash flow.
But ultimately it is the future, not the past, that will determine how well the owners of this business will do. Therefore we think it advisable to take a look at this free report showing whether analysts are predicting a brighter future.
NB: Figures in this article are calculated using data from the last twelve months, which refer to the 12-month period ending on the last date of the month the financial statement is dated. This may not be consistent with full year annual report figures.
Have feedback on this article? Concerned about the content? Get in touch with us directly. Alternatively, email editorial-team (at) simplywallst.com.
This article by Simply Wall St is general in nature. We provide commentary based on historical data and analyst forecasts only using an unbiased methodology and our articles are not intended to be financial advice. It does not constitute a recommendation to buy or sell any stock, and does not take account of your objectives, or your financial situation. We aim to bring you long-term focused analysis driven by fundamental data. Note that our analysis may not factor in the latest price-sensitive company announcements or qualitative material. Simply Wall St has no position in any stocks mentioned.
Join A Paid User Research Session
You’ll receive a US$30 Amazon Gift card for 1 hour of your time while helping us build better investing tools for the individual investors like yourself. Sign up here
