
 Yahoo Finance
 We're Watching These Trends At Yangarra Resources (TSE:YGR)
If we want to find a potential multi-bagger, often there are underlying trends that can provide clues. Firstly, we'd want to identify a growing return on capital employed (ROCE) and then alongside that, an ever-increasing base of capital employed. Basically this means that a company has profitable initiatives that it can continue to reinvest in, which is a trait of a compounding machine. However, after investigating Yangarra Resources (TSE:YGR), we don't think it's current trends fit the mold of a multi-bagger.
Return On Capital Employed (ROCE): What is it?
For those that aren't sure what ROCE is, it measures the amount of pre-tax profits a company can generate from the capital employed in its business. Analysts use this formula to calculate it for Yangarra Resources:
Return on Capital Employed = Earnings Before Interest and Tax (EBIT) ÷ (Total Assets - Current Liabilities)
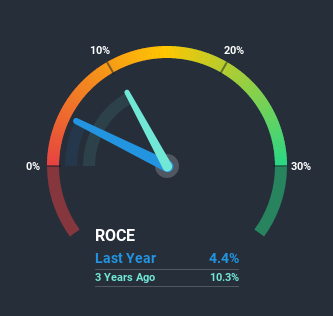
0.044 = CA$26m ÷ (CA$604m - CA$17m) (Based on the trailing twelve months to September 2020).
Thus, Yangarra Resources has an ROCE of 4.4%. In absolute terms, that's a low return and it also under-performs the Oil and Gas industry average of 6.3%.
View our latest analysis for Yangarra Resources
Above you can see how the current ROCE for Yangarra Resources compares to its prior returns on capital, but there's only so much you can tell from the past. If you'd like to see what analysts are forecasting going forward, you should check out our free report for Yangarra Resources.
The Trend Of ROCE
When we looked at the ROCE trend at Yangarra Resources, we didn't gain much confidence. Over the last five years, returns on capital have decreased to 4.4% from 9.0% five years ago. And considering revenue has dropped while employing more capital, we'd be cautious. This could mean that the business is losing its competitive advantage or market share, because while more money is being put into ventures, it's actually producing a lower return - "less bang for their buck" per se.
On a side note, Yangarra Resources has done well to pay down its current liabilities to 2.9% of total assets. That could partly explain why the ROCE has dropped. Effectively this means their suppliers or short-term creditors are funding less of the business, which reduces some elements of risk. Some would claim this reduces the business' efficiency at generating ROCE since it is now funding more of the operations with its own money.
In Conclusion...
In summary, we're somewhat concerned by Yangarra Resources' diminishing returns on increasing amounts of capital. Despite the concerning underlying trends, the stock has actually gained 37% over the last five years, so it might be that the investors are expecting the trends to reverse. Either way, we aren't huge fans of the current trends and so with that we think you might find better investments elsewhere.
On a final note, we found 4 warning signs for Yangarra Resources (1 is a bit unpleasant) you should be aware of.
For those who like to invest in solid companies, check out this free list of companies with solid balance sheets and high returns on equity.
This article by Simply Wall St is general in nature. It does not constitute a recommendation to buy or sell any stock, and does not take account of your objectives, or your financial situation. We aim to bring you long-term focused analysis driven by fundamental data. Note that our analysis may not factor in the latest price-sensitive company announcements or qualitative material. Simply Wall St has no position in any stocks mentioned.
Have feedback on this article? Concerned about the content? Get in touch with us directly. Alternatively, email editorial-team (at) simplywallst.com.
