
 Yahoo Finance
 We're Not Very Worried About Golden Arrow Resources's (CVE:GRG) Cash Burn Rate

We can readily understand why investors are attracted to unprofitable companies. For example, biotech and mining exploration companies often lose money for years before finding success with a new treatment or mineral discovery. But while history lauds those rare successes, those that fail are often forgotten; who remembers Pets.com?
So should Golden Arrow Resources (CVE:GRG) shareholders be worried about its cash burn? In this report, we will consider the company's annual negative free cash flow, henceforth referring to it as the 'cash burn'. First, we'll determine its cash runway by comparing its cash burn with its cash reserves.
See our latest analysis for Golden Arrow Resources
How Long Is Golden Arrow Resources's Cash Runway?
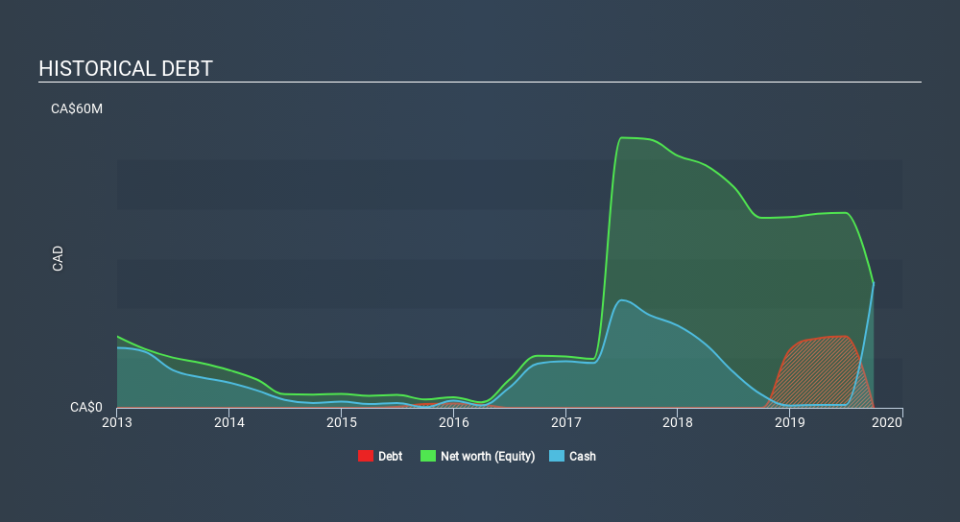
A company's cash runway is the amount of time it would take to burn through its cash reserves at its current cash burn rate. When Golden Arrow Resources last reported its balance sheet in September 2019, it had zero debt and cash worth CA$25m. In the last year, its cash burn was CA$6.9m. That means it had a cash runway of about 3.6 years as of September 2019. A runway of this length affords the company the time and space it needs to develop the business. The image below shows how its cash balance has been changing over the last few years.
How Is Golden Arrow Resources's Cash Burn Changing Over Time?
Because Golden Arrow Resources isn't currently generating revenue, we consider it an early-stage business. So while we can't look to sales to understand growth, we can look at how the cash burn is changing to understand how expenditure is trending over time. With cash burn dropping by 7.9% it seems management feel the company is spending enough to advance its business plans at an appropriate pace. Admittedly, we're a bit cautious of Golden Arrow Resources due to its lack of significant operating revenues. We prefer most of the stocks on this list of stocks that analysts expect to grow.
How Easily Can Golden Arrow Resources Raise Cash?
While Golden Arrow Resources is showing a solid reduction in its cash burn, it's still worth considering how easily it could raise more cash, even just to fuel faster growth. Companies can raise capital through either debt or equity. One of the main advantages held by publicly listed companies is that they can sell shares to investors to raise cash to fund growth. By looking at a company's cash burn relative to its market capitalisation, we gain insight on how much shareholders would be diluted if the company needed to raise enough cash to cover another year's cash burn.
Golden Arrow Resources has a market capitalisation of CA$19m and burnt through CA$6.9m last year, which is 36% of the company's market value. That's not insignificant, and if the company had to sell enough shares to fund another year's growth at the current share price, you'd likely witness fairly costly dilution.
How Risky Is Golden Arrow Resources's Cash Burn Situation?
On this analysis of Golden Arrow Resources's cash burn, we think its cash runway was reassuring, while its cash burn relative to its market cap has us a bit worried. Considering all the factors discussed in this article, we're not overly concerned about the company's cash burn, although we do think shareholders should keep an eye on how it develops. While it's important to consider hard data like the metrics discussed above, many investors would also be interested to note that Golden Arrow Resources insiders have been trading shares in the company. Click here to find out if they have been buying or selling.
Of course, you might find a fantastic investment by looking elsewhere. So take a peek at this free list of interesting companies, and this list of stocks growth stocks (according to analyst forecasts)
If you spot an error that warrants correction, please contact the editor at editorial-team@simplywallst.com. This article by Simply Wall St is general in nature. It does not constitute a recommendation to buy or sell any stock, and does not take account of your objectives, or your financial situation. Simply Wall St has no position in the stocks mentioned.
We aim to bring you long-term focused research analysis driven by fundamental data. Note that our analysis may not factor in the latest price-sensitive company announcements or qualitative material. Thank you for reading.
