
 Yahoo Finance
 Should Weakness in Polaris Infrastructure Inc.'s (TSE:PIF) Stock Be Seen As A Sign That Market Will Correct The Share Price Given Decent Financials?
With its stock down 5.7% over the past three months, it is easy to disregard Polaris Infrastructure (TSE:PIF). However, stock prices are usually driven by a company’s financials over the long term, which in this case look pretty respectable. Specifically, we decided to study Polaris Infrastructure's ROE in this article.
ROE or return on equity is a useful tool to assess how effectively a company can generate returns on the investment it received from its shareholders. In short, ROE shows the profit each dollar generates with respect to its shareholder investments.
View our latest analysis for Polaris Infrastructure
How Is ROE Calculated?
The formula for ROE is:
Return on Equity = Net Profit (from continuing operations) ÷ Shareholders' Equity
So, based on the above formula, the ROE for Polaris Infrastructure is:
9.4% = US$25m ÷ US$264m (Based on the trailing twelve months to June 2021).
The 'return' refers to a company's earnings over the last year. Another way to think of that is that for every CA$1 worth of equity, the company was able to earn CA$0.09 in profit.
What Has ROE Got To Do With Earnings Growth?
So far, we've learned that ROE is a measure of a company's profitability. Based on how much of its profits the company chooses to reinvest or "retain", we are then able to evaluate a company's future ability to generate profits. Generally speaking, other things being equal, firms with a high return on equity and profit retention, have a higher growth rate than firms that don’t share these attributes.
A Side By Side comparison of Polaris Infrastructure's Earnings Growth And 9.4% ROE
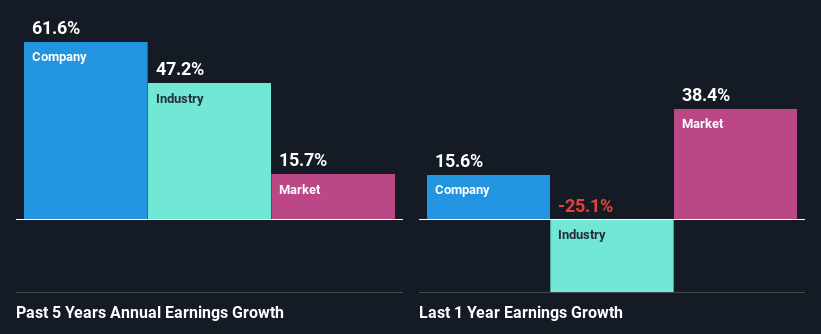
When you first look at it, Polaris Infrastructure's ROE doesn't look that attractive. Yet, a closer study shows that the company's ROE is similar to the industry average of 9.4%. Particularly, the exceptional 62% net income growth seen by Polaris Infrastructure over the past five years is pretty remarkable. Given the slightly low ROE, it is likely that there could be some other aspects that are driving this growth. For example, it is possible that the company's management has made some good strategic decisions, or that the company has a low payout ratio.
We then compared Polaris Infrastructure's net income growth with the industry and we're pleased to see that the company's growth figure is higher when compared with the industry which has a growth rate of 47% in the same period.
Earnings growth is an important metric to consider when valuing a stock. It’s important for an investor to know whether the market has priced in the company's expected earnings growth (or decline). Doing so will help them establish if the stock's future looks promising or ominous. Is Polaris Infrastructure fairly valued compared to other companies? These 3 valuation measures might help you decide.
Is Polaris Infrastructure Using Its Retained Earnings Effectively?
Polaris Infrastructure's significant three-year median payout ratio of 55% (where it is retaining only 45% of its income) suggests that the company has been able to achieve a high growth in earnings despite returning most of its income to shareholders.
Besides, Polaris Infrastructure has been paying dividends over a period of six years. This shows that the company is committed to sharing profits with its shareholders. Our latest analyst data shows that the future payout ratio of the company is expected to rise to 73% over the next three years.
Summary
On the whole, we do feel that Polaris Infrastructure has some positive attributes. Namely, its high earnings growth. We do however feel that the earnings growth number could have been even higher, had the company been reinvesting more of its earnings and paid out less dividends. So far, we've only made a quick discussion around the company's earnings growth. So it may be worth checking this free detailed graph of Polaris Infrastructure's past earnings, as well as revenue and cash flows to get a deeper insight into the company's performance.
This article by Simply Wall St is general in nature. We provide commentary based on historical data and analyst forecasts only using an unbiased methodology and our articles are not intended to be financial advice. It does not constitute a recommendation to buy or sell any stock, and does not take account of your objectives, or your financial situation. We aim to bring you long-term focused analysis driven by fundamental data. Note that our analysis may not factor in the latest price-sensitive company announcements or qualitative material. Simply Wall St has no position in any stocks mentioned.
Have feedback on this article? Concerned about the content? Get in touch with us directly. Alternatively, email editorial-team (at) simplywallst.com.
