
 Yahoo Finance
 Be Wary Of Urban Outfitters (NASDAQ:URBN) And Its Returns On Capital
If we want to find a potential multi-bagger, often there are underlying trends that can provide clues. Ideally, a business will show two trends; firstly a growing return on capital employed (ROCE) and secondly, an increasing amount of capital employed. If you see this, it typically means it's a company with a great business model and plenty of profitable reinvestment opportunities. However, after briefly looking over the numbers, we don't think Urban Outfitters (NASDAQ:URBN) has the makings of a multi-bagger going forward, but let's have a look at why that may be.
Understanding Return On Capital Employed (ROCE)
If you haven't worked with ROCE before, it measures the 'return' (pre-tax profit) a company generates from capital employed in its business. To calculate this metric for Urban Outfitters, this is the formula:
Return on Capital Employed = Earnings Before Interest and Tax (EBIT) ÷ (Total Assets - Current Liabilities)
0.11 = US$301m ÷ (US$3.7b - US$967m) (Based on the trailing twelve months to July 2022).
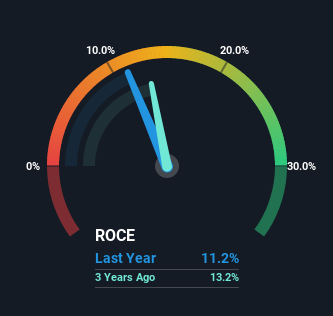
Therefore, Urban Outfitters has an ROCE of 11%. In isolation, that's a pretty standard return but against the Specialty Retail industry average of 17%, it's not as good.
Check out our latest analysis for Urban Outfitters
In the above chart we have measured Urban Outfitters' prior ROCE against its prior performance, but the future is arguably more important. If you'd like, you can check out the forecasts from the analysts covering Urban Outfitters here for free.
What The Trend Of ROCE Can Tell Us
When we looked at the ROCE trend at Urban Outfitters, we didn't gain much confidence. To be more specific, ROCE has fallen from 17% over the last five years. Although, given both revenue and the amount of assets employed in the business have increased, it could suggest the company is investing in growth, and the extra capital has led to a short-term reduction in ROCE. And if the increased capital generates additional returns, the business, and thus shareholders, will benefit in the long run.
The Bottom Line On Urban Outfitters' ROCE
Even though returns on capital have fallen in the short term, we find it promising that revenue and capital employed have both increased for Urban Outfitters. These trends are starting to be recognized by investors since the stock has delivered a 2.8% gain to shareholders who've held over the last five years. So this stock may still be an appealing investment opportunity, if other fundamentals prove to be sound.
Urban Outfitters does have some risks, we noticed 2 warning signs (and 1 which is potentially serious) we think you should know about.
If you want to search for solid companies with great earnings, check out this free list of companies with good balance sheets and impressive returns on equity.
Have feedback on this article? Concerned about the content? Get in touch with us directly. Alternatively, email editorial-team (at) simplywallst.com.
This article by Simply Wall St is general in nature. We provide commentary based on historical data and analyst forecasts only using an unbiased methodology and our articles are not intended to be financial advice. It does not constitute a recommendation to buy or sell any stock, and does not take account of your objectives, or your financial situation. We aim to bring you long-term focused analysis driven by fundamental data. Note that our analysis may not factor in the latest price-sensitive company announcements or qualitative material. Simply Wall St has no position in any stocks mentioned.
Join A Paid User Research Session
You’ll receive a US$30 Amazon Gift card for 1 hour of your time while helping us build better investing tools for the individual investors like yourself. Sign up here
