
 Yahoo Finance
 Be Wary Of PetMed Express (NASDAQ:PETS) And Its Returns On Capital
Did you know there are some financial metrics that can provide clues of a potential multi-bagger? Firstly, we'd want to identify a growing return on capital employed (ROCE) and then alongside that, an ever-increasing base of capital employed. Put simply, these types of businesses are compounding machines, meaning they are continually reinvesting their earnings at ever-higher rates of return. In light of that, when we looked at PetMed Express (NASDAQ:PETS) and its ROCE trend, we weren't exactly thrilled.
Understanding Return On Capital Employed (ROCE)
If you haven't worked with ROCE before, it measures the 'return' (pre-tax profit) a company generates from capital employed in its business. To calculate this metric for PetMed Express, this is the formula:
Return on Capital Employed = Earnings Before Interest and Tax (EBIT) ÷ (Total Assets - Current Liabilities)
0.18 = US$26m ÷ (US$176m - US$33m) (Based on the trailing twelve months to March 2022).
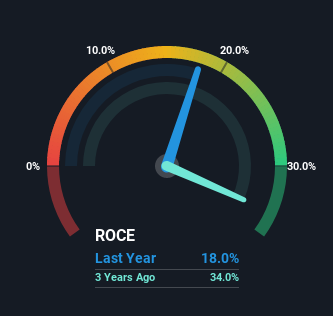
Thus, PetMed Express has an ROCE of 18%. In absolute terms, that's a satisfactory return, but compared to the Online Retail industry average of 12% it's much better.
Check out our latest analysis for PetMed Express
Above you can see how the current ROCE for PetMed Express compares to its prior returns on capital, but there's only so much you can tell from the past. If you'd like, you can check out the forecasts from the analysts covering PetMed Express here for free.
What The Trend Of ROCE Can Tell Us
In terms of PetMed Express' historical ROCE movements, the trend isn't fantastic. Around five years ago the returns on capital were 40%, but since then they've fallen to 18%. Given the business is employing more capital while revenue has slipped, this is a bit concerning. This could mean that the business is losing its competitive advantage or market share, because while more money is being put into ventures, it's actually producing a lower return - "less bang for their buck" per se.
What We Can Learn From PetMed Express' ROCE
From the above analysis, we find it rather worrisome that returns on capital and sales for PetMed Express have fallen, meanwhile the business is employing more capital than it was five years ago. Investors haven't taken kindly to these developments, since the stock has declined 24% from where it was five years ago. With underlying trends that aren't great in these areas, we'd consider looking elsewhere.
One more thing: We've identified 2 warning signs with PetMed Express (at least 1 which shouldn't be ignored) , and understanding them would certainly be useful.
For those who like to invest in solid companies, check out this free list of companies with solid balance sheets and high returns on equity.
Have feedback on this article? Concerned about the content? Get in touch with us directly. Alternatively, email editorial-team (at) simplywallst.com.
This article by Simply Wall St is general in nature. We provide commentary based on historical data and analyst forecasts only using an unbiased methodology and our articles are not intended to be financial advice. It does not constitute a recommendation to buy or sell any stock, and does not take account of your objectives, or your financial situation. We aim to bring you long-term focused analysis driven by fundamental data. Note that our analysis may not factor in the latest price-sensitive company announcements or qualitative material. Simply Wall St has no position in any stocks mentioned.
