
 Yahoo Finance
 Volatility 101: Should Linamar (TSE:LNR) Shares Have Dropped 30%?

Investors can approximate the average market return by buying an index fund. Active investors aim to buy stocks that vastly outperform the market - but in the process, they risk under-performance. Unfortunately the Linamar Corporation (TSE:LNR) share price slid 30% over twelve months. That contrasts poorly with the market return of 2.8%. At least the damage isn't so bad if you look at the last three years, since the stock is down 22% in that time. The falls have accelerated recently, with the share price down 12% in the last three months.
View our latest analysis for Linamar
While markets are a powerful pricing mechanism, share prices reflect investor sentiment, not just underlying business performance. By comparing earnings per share (EPS) and share price changes over time, we can get a feel for how investor attitudes to a company have morphed over time.
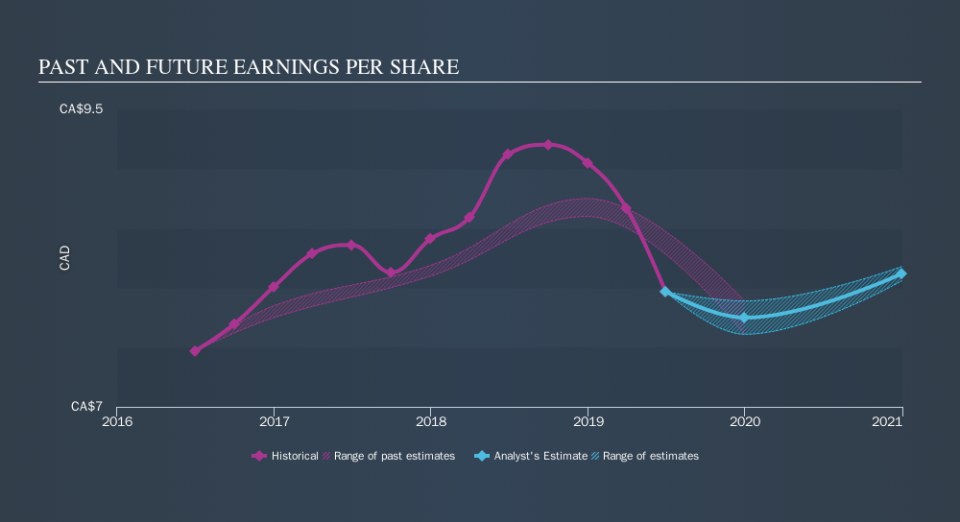
Unfortunately Linamar reported an EPS drop of 13% for the last year. The share price decline of 30% is actually more than the EPS drop. So it seems the market was too confident about the business, a year ago. The P/E ratio of 5.31 also points to the negative market sentiment.
You can see below how EPS has changed over time (discover the exact values by clicking on the image).
It's good to see that there was some significant insider buying in the last three months. That's a positive. That said, we think earnings and revenue growth trends are even more important factors to consider. Dive deeper into the earnings by checking this interactive graph of Linamar's earnings, revenue and cash flow.
What about the Total Shareholder Return (TSR)?
We've already covered Linamar's share price action, but we should also mention its total shareholder return (TSR). Arguably the TSR is a more complete return calculation because it accounts for the value of dividends (as if they were reinvested), along with the hypothetical value of any discounted capital that have been offered to shareholders. Linamar's TSR of was a loss of 29% for the year. That wasn't as bad as its share price return, because it has paid dividends.
A Different Perspective
Linamar shareholders are down 29% for the year (even including dividends) , but the market itself is up 2.8%. Even the share prices of good stocks drop sometimes, but we want to see improvements in the fundamental metrics of a business, before getting too interested. Unfortunately, last year's performance may indicate unresolved challenges, given that it was worse than the annualised loss of 5.3% over the last half decade. Generally speaking long term share price weakness can be a bad sign, though contrarian investors might want to research the stock in hope of a turnaround. Investors who like to make money usually check up on insider purchases, such as the price paid, and total amount bought. You can find out about the insider purchases of Linamar by clicking this link.
Linamar is not the only stock insiders are buying. So take a peek at this free list of growing companies with insider buying.
Please note, the market returns quoted in this article reflect the market weighted average returns of stocks that currently trade on CA exchanges.
We aim to bring you long-term focused research analysis driven by fundamental data. Note that our analysis may not factor in the latest price-sensitive company announcements or qualitative material.
If you spot an error that warrants correction, please contact the editor at editorial-team@simplywallst.com. This article by Simply Wall St is general in nature. It does not constitute a recommendation to buy or sell any stock, and does not take account of your objectives, or your financial situation. Simply Wall St has no position in the stocks mentioned. Thank you for reading.
