
 Yahoo Finance
 Is Vital Energy Inc.’s (CVE:VUX) Return On Capital Employed Any Good?

Today we'll evaluate Vital Energy Inc. (CVE:VUX) to determine whether it could have potential as an investment idea. In particular, we'll consider its Return On Capital Employed (ROCE), as that can give us insight into how profitably the company is able to employ capital in its business.
Firstly, we'll go over how we calculate ROCE. Next, we'll compare it to others in its industry. Then we'll determine how its current liabilities are affecting its ROCE.
What is Return On Capital Employed (ROCE)?
ROCE is a metric for evaluating how much pre-tax income (in percentage terms) a company earns on the capital invested in its business. All else being equal, a better business will have a higher ROCE. Ultimately, it is a useful but imperfect metric. Author Edwin Whiting says to be careful when comparing the ROCE of different businesses, since 'No two businesses are exactly alike.
So, How Do We Calculate ROCE?
Analysts use this formula to calculate return on capital employed:
Return on Capital Employed = Earnings Before Interest and Tax (EBIT) ÷ (Total Assets - Current Liabilities)
Or for Vital Energy:
0.069 = CA$839k ÷ (CA$16m - CA$3.4m) (Based on the trailing twelve months to December 2019.)
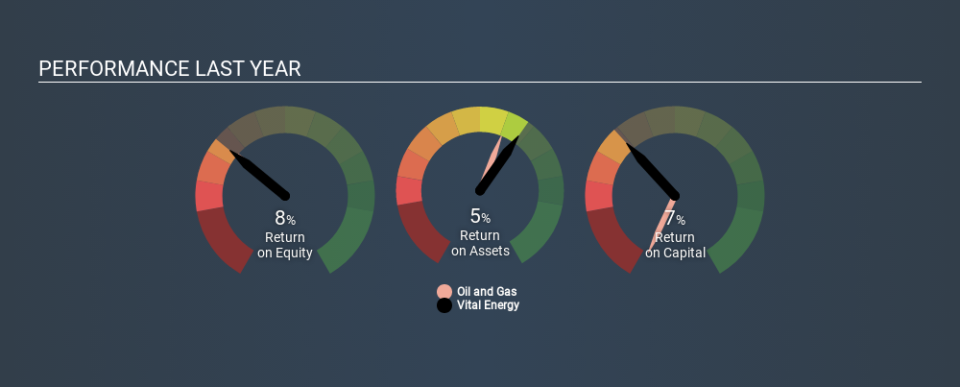
Therefore, Vital Energy has an ROCE of 6.9%.
View our latest analysis for Vital Energy
Is Vital Energy's ROCE Good?
ROCE can be useful when making comparisons, such as between similar companies. It appears that Vital Energy's ROCE is fairly close to the Oil and Gas industry average of 5.8%. Aside from the industry comparison, Vital Energy's ROCE is mediocre in absolute terms, considering the risk of investing in stocks versus the safety of a bank account. Investors may wish to consider higher-performing investments.
Vital Energy delivered an ROCE of 6.9%, which is better than 3 years ago, as was making losses back then. This makes us wonder if the company is improving. You can click on the image below to see (in greater detail) how Vital Energy's past growth compares to other companies.
When considering this metric, keep in mind that it is backwards looking, and not necessarily predictive. ROCE can be deceptive for cyclical businesses, as returns can look incredible in boom times, and terribly low in downturns. This is because ROCE only looks at one year, instead of considering returns across a whole cycle. We note Vital Energy could be considered a cyclical business. You can check if Vital Energy has cyclical profits by looking at this free graph of past earnings, revenue and cash flow.
What Are Current Liabilities, And How Do They Affect Vital Energy's ROCE?
Current liabilities are short term bills and invoices that need to be paid in 12 months or less. The ROCE equation subtracts current liabilities from capital employed, so a company with a lot of current liabilities appears to have less capital employed, and a higher ROCE than otherwise. To check the impact of this, we calculate if a company has high current liabilities relative to its total assets.
Vital Energy has total assets of CA$16m and current liabilities of CA$3.4m. As a result, its current liabilities are equal to approximately 22% of its total assets. This is a modest level of current liabilities, which would only have a small effect on ROCE.
The Bottom Line On Vital Energy's ROCE
With that in mind, we're not overly impressed with Vital Energy's ROCE, so it may not be the most appealing prospect. You might be able to find a better investment than Vital Energy. If you want a selection of possible winners, check out this free list of interesting companies that trade on a P/E below 20 (but have proven they can grow earnings).
If you like to buy stocks alongside management, then you might just love this free list of companies. (Hint: insiders have been buying them).
Love or hate this article? Concerned about the content? Get in touch with us directly. Alternatively, email editorial-team@simplywallst.com.
This article by Simply Wall St is general in nature. It does not constitute a recommendation to buy or sell any stock, and does not take account of your objectives, or your financial situation. We aim to bring you long-term focused analysis driven by fundamental data. Note that our analysis may not factor in the latest price-sensitive company announcements or qualitative material. Simply Wall St has no position in any stocks mentioned. Thank you for reading.
