
 Yahoo Finance
 Vicinity Motor (CVE:VMC) Shareholders Will Want The ROCE Trajectory To Continue
Did you know there are some financial metrics that can provide clues of a potential multi-bagger? In a perfect world, we'd like to see a company investing more capital into its business and ideally the returns earned from that capital are also increasing. This shows us that it's a compounding machine, able to continually reinvest its earnings back into the business and generate higher returns. With that in mind, we've noticed some promising trends at Vicinity Motor (CVE:VMC) so let's look a bit deeper.
Understanding Return On Capital Employed (ROCE)
Just to clarify if you're unsure, ROCE is a metric for evaluating how much pre-tax income (in percentage terms) a company earns on the capital invested in its business. The formula for this calculation on Vicinity Motor is:
Return on Capital Employed = Earnings Before Interest and Tax (EBIT) ÷ (Total Assets - Current Liabilities)
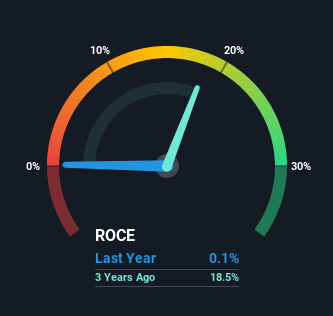
0.0012 = CA$41k ÷ (CA$42m - CA$7.3m) (Based on the trailing twelve months to June 2021).
Therefore, Vicinity Motor has an ROCE of 0.1%. In absolute terms, that's a low return and it also under-performs the Machinery industry average of 8.6%.
Check out our latest analysis for Vicinity Motor
While the past is not representative of the future, it can be helpful to know how a company has performed historically, which is why we have this chart above. If you want to delve into the historical earnings, revenue and cash flow of Vicinity Motor, check out these free graphs here.
How Are Returns Trending?
We're delighted to see that Vicinity Motor is reaping rewards from its investments and is now generating some pre-tax profits. About five years ago the company was generating losses but things have turned around because it's now earning 0.1% on its capital. In addition to that, Vicinity Motor is employing 2,455% more capital than previously which is expected of a company that's trying to break into profitability. We like this trend, because it tells us the company has profitable reinvestment opportunities available to it, and if it continues going forward that can lead to a multi-bagger performance.
In another part of our analysis, we noticed that the company's ratio of current liabilities to total assets decreased to 17%, which broadly means the business is relying less on its suppliers or short-term creditors to fund its operations. So this improvement in ROCE has come from the business' underlying economics, which is great to see.
The Bottom Line
In summary, it's great to see that Vicinity Motor has managed to break into profitability and is continuing to reinvest in its business. Since the stock has returned a staggering 356% to shareholders over the last five years, it looks like investors are recognizing these changes. So given the stock has proven it has promising trends, it's worth researching the company further to see if these trends are likely to persist.
One final note, you should learn about the 3 warning signs we've spotted with Vicinity Motor (including 1 which is a bit concerning) .
While Vicinity Motor isn't earning the highest return, check out this free list of companies that are earning high returns on equity with solid balance sheets.
This article by Simply Wall St is general in nature. We provide commentary based on historical data and analyst forecasts only using an unbiased methodology and our articles are not intended to be financial advice. It does not constitute a recommendation to buy or sell any stock, and does not take account of your objectives, or your financial situation. We aim to bring you long-term focused analysis driven by fundamental data. Note that our analysis may not factor in the latest price-sensitive company announcements or qualitative material. Simply Wall St has no position in any stocks mentioned.
Have feedback on this article? Concerned about the content? Get in touch with us directly. Alternatively, email editorial-team (at) simplywallst.com.
