
 Yahoo Finance
 A Very Informative Chart From Bank of America
Every time Bank of America (NYSE: BAC) reports quarterly earnings, it includes a presentation deck to illustrate the bank's performance over the previous three months.
Its latest presentation covers a variety of topics, including loan growth, asset quality, and expense highlights. But the most informative slide concerns so-called operating leverage.

This is a term that refers to relative growth rates of a bank's revenue and expenses. A bank that grows revenue faster than expenses is said to have generated positive operating leverage. Alternatively, a bank that grows expenses faster than revenue is said to have generated negative operating leverage.
Banks that control 10% of domestic deposits -- such as Bank of America -- are prohibited from growing their earnings by acquiring other banks. For those banks' investors, operating leverage is an especially important metric to watch, as it reflects a bank's organic earnings growth.
Bank of America spent much of the past decade reporting negative operating leverage. The trend was fueled by the financial crisis, which caused expenses at the nation's second-biggest bank to soar. All told, the crisis cost the Charlotte, North Carolina-based bank upwards of $200 billion in added legal fees and loan charge-offs.
Starting in the first quarter of 2015, however, this trend reversed course. Bank of America has now produced positive operating leverage in 11 consecutive quarters.
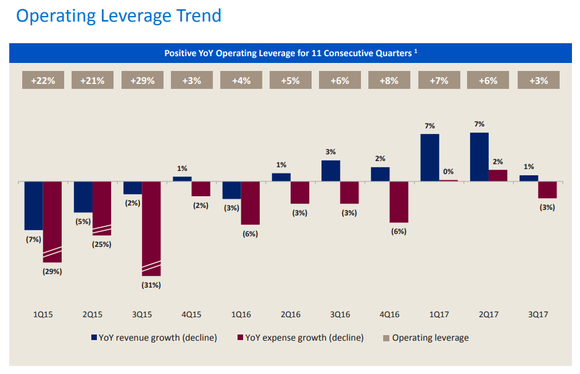
In the first five quarters of the trend, Bank of America's positive operating leverage was produced by expenses declining at a quicker pace than revenue. But starting in the second quarter of 2016, revenue started to climb, while expenses continued to fall. That has been the case in four out of the past six quarters.
In the latest quarter, Bank of America generated positive operating leverage of 3%. This came from a roughly 1% revenue growth compared to a 3% decline in noninterest expenses (rounding explains why this doesn't add up to 4% operative leverage).
This is of course a very positive trend for Bank of America shareholders, who have seen the bank's earnings per share grow as a result. It also goes a long way to explain why the bank's profitability and efficiency are improving and closing in on, or surpassing, the bank's performance targets.
More From The Motley Fool
Why You're Smart to Buy Shopify Inc. (US) -- Despite Citron's Report
6 Years Later, 6 Charts That Show How Far Apple, Inc. Has Come Since Steve Jobs' Passing
NVIDIA Scores 2 Drone Wins -- Including the AI for an E-Commerce Giant's Delivery Drones
John Maxfield owns shares of Bank of America. The Motley Fool has no position in any of the stocks mentioned. The Motley Fool has a disclosure policy.
