
 Yahoo Finance
 Vermilion Energy's (TSE:VET) Shareholders Will Receive A Bigger Dividend Than Last Year
Vermilion Energy Inc.'s (TSE:VET) dividend will be increasing from last year's payment of the same period to CA$0.10 on 17th of April. This takes the annual payment to 2.1% of the current stock price, which unfortunately is below what the industry is paying.
Check out our latest analysis for Vermilion Energy
Vermilion Energy's Dividend Is Well Covered By Earnings
The dividend yield is a little bit low, but sustainability of the payments is also an important part of evaluating an income stock. However, prior to this announcement, Vermilion Energy's dividend was comfortably covered by both cash flow and earnings. This means that most of its earnings are being retained to grow the business.
EPS is set to fall by 42.2% over the next 12 months. Assuming the dividend continues along recent trends, we believe the payout ratio could be 5.1%, which we are pretty comfortable with and we think is feasible on an earnings basis.
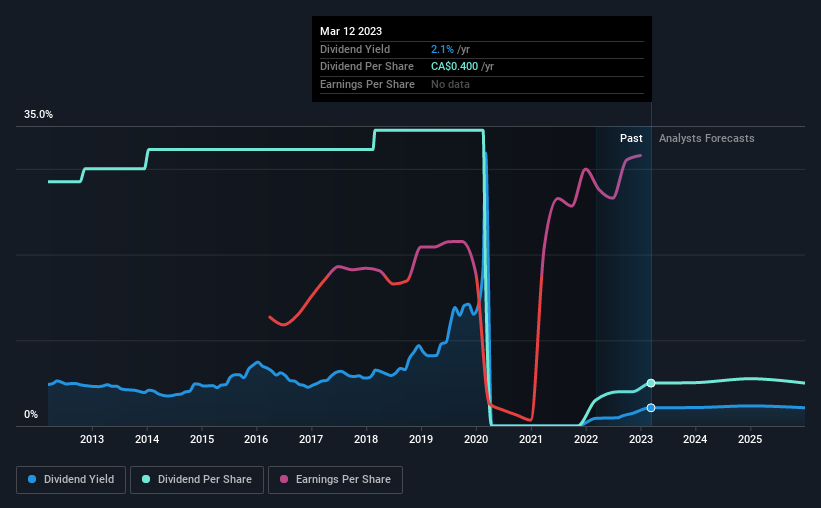
Dividend Volatility
The company's dividend history has been marked by instability, with at least one cut in the last 10 years. Since 2013, the annual payment back then was CA$2.28, compared to the most recent full-year payment of CA$0.40. The dividend has fallen 82% over that period. A company that decreases its dividend over time generally isn't what we are looking for.
The Dividend Looks Likely To Grow
Dividends have been going in the wrong direction, so we definitely want to see a different trend in the earnings per share. We are encouraged to see that Vermilion Energy has grown earnings per share at 73% per year over the past five years. Rapid earnings growth and a low payout ratio suggest this company has been effectively reinvesting in its business. Should that continue, this company could have a bright future.
Vermilion Energy Looks Like A Great Dividend Stock
In summary, it is always positive to see the dividend being increased, and we are particularly pleased with its overall sustainability. The company is generating plenty of cash, and the earnings also quite easily cover the distributions. If earnings do fall over the next 12 months, the dividend could be buffeted a little bit, but we don't think it should cause too much of a problem in the long term. Taking this all into consideration, this looks like it could be a good dividend opportunity.
Market movements attest to how highly valued a consistent dividend policy is compared to one which is more unpredictable. However, there are other things to consider for investors when analysing stock performance. Just as an example, we've come across 3 warning signs for Vermilion Energy you should be aware of, and 1 of them doesn't sit too well with us. Looking for more high-yielding dividend ideas? Try our collection of strong dividend payers.
Have feedback on this article? Concerned about the content? Get in touch with us directly. Alternatively, email editorial-team (at) simplywallst.com.
This article by Simply Wall St is general in nature. We provide commentary based on historical data and analyst forecasts only using an unbiased methodology and our articles are not intended to be financial advice. It does not constitute a recommendation to buy or sell any stock, and does not take account of your objectives, or your financial situation. We aim to bring you long-term focused analysis driven by fundamental data. Note that our analysis may not factor in the latest price-sensitive company announcements or qualitative material. Simply Wall St has no position in any stocks mentioned.
Join A Paid User Research Session
You’ll receive a US$30 Amazon Gift card for 1 hour of your time while helping us build better investing tools for the individual investors like yourself. Sign up here
