
 Yahoo Finance
 Verizon's (NYSE:VZ) Price is Lagging the Market Prospects and Dividend Strengths
This article first appeared on Simply Wall St News.
After 3 years, Verizon Communications Inc. (NYSE: VZ) stock is back on the starting line. While it might be frustrating for the investors, periods of sideways price movement have been reoccurring throughout its history.
Yet, with a high 4.8% yield and some new developments, the stock might be undervalued at the moment. This article will examine this possibility through a discounted cash flow (DCF) method.
See our latest analysis for Verizon Communications
5G Expansion Continues
Verizon continues with a firm dividend policy, raising it by 2% from US$0.6275 to US$0.64. This gives the current forward yield of 4.74%. The next dividend payout is on November 1st, with the ex-dividend date set for October 7th.
The company announced that the Yahoo deal had finally been closed with Apollo Global Management. Verizon will retain a 10% stake, with Yahoo now operating as a standalone entity.
Additionally, Verizon has signed a new 10-year partnership with the National Football League (NFL). During that period, Verizon will leverage the power of 5G technology to improve the NFL experiences for both players and fans.
Meanwhile, 5G expansion continues with the 5G Ultra Wideband mobility service now available in parts of 82 cities and 5G Home Internet in parts of 57 cities. 5G Home offers truly unlimited internet service with no data caps – ideal for remote workers or anyone who heavily depends on the internet, like gamers and streamers.
As Verizon keeps moving toward renewable energy, the company priced the third "green bond." The proceeds of US$1b are planned to be entirely invested in solar and wind power facilities through long-term virtual power purchase agreements (VPPAs).
Examining the Intrinsic Value
We generally believe that a company's value is the present value of all cash it will generate in the future. However, a DCF is just one valuation metric among many, and it is not without flaws. Anyone interested in learning a bit more about intrinsic value should have a read of the Simply Wall St analysis model.
Step by step through the calculation
We're using the 2-stage growth model, which simply means we take two stages of the company's growth. In the initial period, the company may have a higher growth rate, and the second stage is usually assumed to have a stable growth rate.
In the first stage, we need to estimate the cash flows to the business over the next ten years. Where possible, we use analyst estimates, but when these aren't available, we extrapolate the previous free cash flow (FCF) from the last estimate or reported value.
We assume companies with shrinking free cash flow will slow their rate of shrinkage and that companies with growing free cash flow will see their growth rate slow over this period. We do this to reflect that growth tends to slow more in the early years than in later years.
Generally, we assume that a dollar today is more valuable than a dollar in the future, so we need to discount the sum of these future cash flows to arrive at a present value estimate:
10-year free cash flow (FCF) estimate
2022 | 2023 | 2024 | 2025 | 2026 | 2027 | 2028 | 2029 | 2030 | 2031 | |
Levered FCF ($, Millions) | US$18.0b | US$18.7b | US$20.9b | US$23.1b | US$24.7b | US$26.0b | US$27.1b | US$28.1b | US$29.0b | US$29.8b |
Growth Rate Estimate Source | Analyst x15 | Analyst x8 | Analyst x5 | Analyst x5 | Est @ 6.7% | Est @ 5.29% | Est @ 4.3% | Est @ 3.61% | Est @ 3.12% | Est @ 2.78% |
Present Value ($, Millions) Discounted @ 5.8% | US$17.0k | US$16.7k | US$17.6k | US$18.5k | US$18.7k | US$18.6k | US$18.3k | US$17.9k | US$17.5k | US$17.0k |
("Est" = FCF growth rate estimated by Simply Wall St)
Present Value of 10-year Cash Flow (PVCF) = US$178b
After calculating the present value of future cash flows in the initial 10-year period, we need to calculate the Terminal Value, which accounts for all future cash flows beyond the first stage. For a number of reasons, a very conservative growth rate is used that cannot exceed that of a country's GDP growth.
In this case, we have used the 5-year average of the 10-year government bond yield (2.0%) to estimate future growth. In the same way, as with the 10-year 'growth' period, we discount future cash flows to today's value, using a cost of equity of 5.8%.
Terminal Value (TV)= FCF2031 × (1 + g) ÷ (r - g) = US$30b× (1 + 2.0%) ÷ (5.8%- 2.0%) = US$804b
Present Value of Terminal Value (PVTV)= TV / (1 + r)10= US$804b÷ ( 1 + 5.8%)10= US$459b
The total value is the sum of cash flows for the next ten years plus the discounted terminal value, which results in the Total Equity Value, which in this case is US$637b. The last step is to then divide the equity value by the number of shares outstanding.
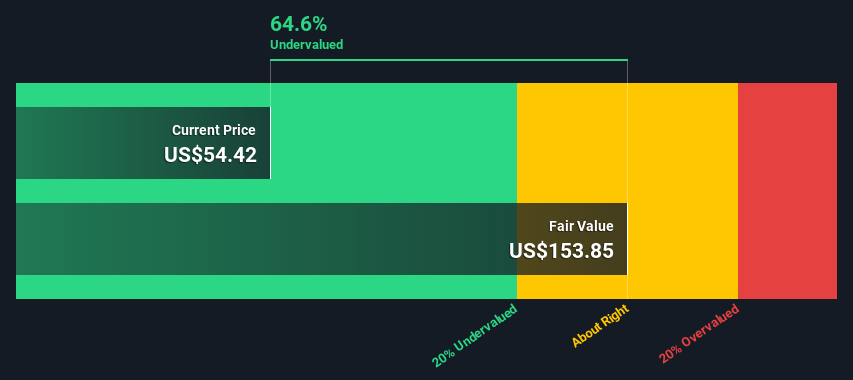
Relative to the current share price of US$54.4, the company appears potentially underpriced at a discount of over 50%.
One should question why the stock appears cheap in this model. Do the inputs we've used seem reasonable? Remember, though, that this is just an approximate valuation, and like any complex formula - garbage in, garbage out.
The assumptions
We would point out that the most critical inputs to a discounted cash flow are the discount rate and, of course, the actual cash flows. The DCF also does not consider the possible cyclicality of an industry or its future capital requirements, so it does not give a complete picture of its potential performance.
Given that we are looking at Verizon Communications as potential shareholders, the cost of equity is used as the discount rate rather than the cost of capital (or the weighted average cost of capital, WACC), which accounts for debt.
We've used 5.8% in this calculation, which is based on a levered beta of 0.800. Beta is a measure of a stock's volatility compared to the market as a whole. We get our beta from the industry average beta of globally comparable companies, with an imposed limit between 0.8 and 2.0, a reasonable range for a stable business.
Looking Ahead:
Although the valuation of a company is important, it is only one of many factors that you need to assess for a company. The DCF model is not a perfect stock valuation tool. Instead, the best use for a DCF model is to test certain assumptions and theories to see if they would lead to undervalued or overvalued. For example, changes in the company's cost of equity or the risk-free rate can significantly impact the valuation.
Why is the intrinsic value higher than the current share price? For Verizon Communications, there are three relevant items you should consider:
Risks: Every company has them, and we've spotted 3 warning signs for Verizon Communications (of which 1 is potentially serious!) you should know about.
Future Earnings: How does VZ's growth rate compare to its peers and the broader market? Dig deeper into the analyst consensus number for the upcoming years by interacting with our free analyst growth expectation chart.
Other High-Quality Alternatives: Do you like a good all-rounder? Explore our interactive list of high-quality stocks to get an idea of what else is out there you may be missing!
PS. Simply Wall St updates its DCF calculation for every American stock every day, so if you want to find the intrinsic value of any other stock, search here.
Simply Wall St analyst Stjepan Kalinic and Simply Wall St have no position in any of the companies mentioned. This article is general in nature. We provide commentary based on historical data and analyst forecasts only using an unbiased methodology and our articles are not intended to be financial advice. It does not constitute a recommendation to buy or sell any stock and does not take account of your objectives, or your financial situation. We aim to bring you long-term focused analysis driven by fundamental data. Note that our analysis may not factor in the latest price-sensitive company announcements or qualitative material.
Have feedback on this article? Concerned about the content? Get in touch with us directly. Alternatively, email editorial-team@simplywallst.com
